kWh Analytics, a climate insurance and renewable energy risk management firm, released its 2022 Solar Generation Index and reports that solar assets are broadly performing below expectations. The report incorporates data from industry collaborators and kWh Analytics’ proprietary Heliostat database.
On average, projects constructed after 2015 have generated 7-13% less electricity than P50 production estimates.

P50 means there is a 50% chance in any given year that production will be at least a specific amount. If an array has a P50 production level of 500 kWh, it means that on any given year there is a 50% chance that production will be at least 500 kWh.
The report concluded that as the gap between actual and expected generation grows, underperformance risk jeopardizes investor returns and the industry’s ability to achieve sustainable growth.
“Underperformance affects investors and lenders critical to the success and growth of solar projects,” said Jason Kaminksy, chief executive officer of kWh Analytics. “As an industry, we must collaborate to find ways to course-correct in order to ensure the industry’s long-term financial health.”
The average performance of projects constructed last year represented a minor improvement compared to 2020. In general, projects built since 2015 are performing worse than those constructed in the early 2010s relative to their P50 estimates.
The kWh Analytics report showed that since 2019, projects with capacity >50 MW have performed worse relative to their P50 estimates than projects with capacity between 1-50 MW.

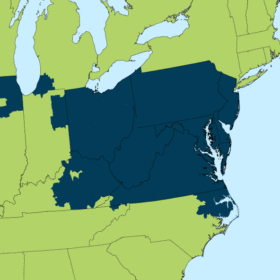
The underperformance trend is a nationwide phenomenon, said kWh Analytics. Under ten years of operational data, average lifetime performance ranged from 5-10% below initial P50 estimates across the seven regions. Over the years, performance continues to decline in each region. The only outliers in 2021 were the Northwest and Southeast regions, which improved by 1% and 2%, respectively.

“It is imperative that we continue to support the long-term success of the renewable energy sector,” said Kaminksy. “To de-risk investments into zero-carbon assets and encourage resilience throughout the industry, sponsors and lenders should consider accurately priced risk-transfer products, be wary of aggressive production forecasts, and be collaborative with stakeholders to encourage data sharing.”
The report also evaluated system performance based on project capacities and mount types and found no underperformance trends isolated to any specific group of projects.
This content is protected by copyright and may not be reused. If you want to cooperate with us and would like to reuse some of our content, please contact: editors@pv-magazine.com.


Very disappointing. What’s up with that?
I’m not seeing any degradation with my thirty 315W Solar World panels installed in 2015. Had one Solar Edge optimizer failure, that’s all. Otherwise year over year production is steady and as designed j predicted apart from weather conditions– mostly higher humidity in summer and fall months of St Petersburg FL.
Also not seeing any what I would call long term conversion efficiency loss amidst the monthly and yearly weather fluctuations.
Perhaps outsourcing and other cost cutting measures have resulted in degraded cell quality, panel glass and encapsulating adhesive stability and broadband spectral transmission to UV.
Cpuld also be attributed to wiring heat and resistance losses which are greater than anticipated for the thousands of feet of long runs to inverters compared to tens of feet in small rooftop systems.
Hard to imagine unit failures are 5% to 10% as installed and not as quickly corrected. But fields with hundreds of thousands of panels, connections and wire runs is not as simple to diagnose and fix as rooftop PV.
Be interested to learn what the bottom line causes turn out to be and what remedies and associated costs are incurred to correct or accept them.
Dust and dirt build up, smoke and pollution in the air, rainless clouds and lingering condensation trails need to be calculated into the projections.
Panels need to be proactively monitored and managed
Sunified UNITY sensors do this function per panel per string every 30 seconds. It’s a real time rating system on each panel.
Refer https://sunified.com/technology
and bit.ly://SolvingTheOracleProblem
https://bit.ly/SolvingTheOracleProblem
The article doesn’t dive down into the reasons for underperformance, but working in the utility solar sector I can tell you there are many factors. Besides weather and panel degradation – we see tracker failures and inverter performance issues/failures that have large impacts on generation.
Inverters that have been installed since 2015 have seen multiple companies cease manufacturing and then pull back hard on quality and timeliness of repair services and parts acquisition.
I believe more data analytics and predictive behavioral diagnostic algorithms with preventive maintainence checks will prevent this by atleast 20 to 40%. Also since for large ground mounted one array malfunction may pull down the performance of other arrays in parallel at SMB level hence to be electronically isolated if mismatch more than 10% between each.
Rest I understand the designs as per PV design softwares are tweaked to provide a very optimistic outcome which is not actually the case in terms of dust and temperatures raised, e.g. a PV module with NOMT 47deg. at ambient of 40 deg. in peak radiation of 1000W/m2 can only by calculation cell temperature may go high as 75 deg.C to 80 deg.C which amounts to a decrease in 20 to 25% module efficiency.