
The National Renewable Energy Laboratory (NREL) has published a report every year since 2010 on photovoltaic (PV) and energy storage costs. The most recent report, U.S. Solar Photovoltaic System and Energy Storage Cost Benchmarks, With Minimum Sustainable Price Analysis: Q1 2022 covers installed costs for PV and storage systems as of the first quarter (Q1) of 2022, and takes into account complications caused by the Covid-19 pandemic, industry specific events, and trade policy debacles.
Findings show that prices soared throughout the U.S. economy between Q1 2021 and Q1 2022, and especially for the PV and energy storage markets. The ongoing Covid-19 pandemic caused supply chain constraints, and industry-specific events and trade policies drove up PV and battery prices. Reports from the U.S. Energy Information Administration showed that while developers had planned to install 17.8 GW in the first half of 2022, only 4.2 GW was installed and brought online—pointing to module supply challenges, which led to cancellations and delays.
As Kristyn Melvin and Matt Bonovich wrote in an OpEd in pv magazine USA in March 2022, “Covid-19 had a serious effect on all supply chains, but because of the level of module (and other) imports depended upon for the U.S. solar industry, the solar supply chain suffered from shortages, high costs of shipping, a spike in the demand for steel, increased gas prices, and rising costs of materials and components.”
Other challenges included the Antidumping and Countervailing Duties (AD/CVD) Anti-Circumvention petition filed by Auxin Solar, the Section 201 Tariffs, and the Uyghur Forced Labor Prevention Act.
- Antidumping: After the Commerce Department had thrown out an earlier request in 2021 by an anonymous group of solar companies seeking tariffs on a handful of companies that import modules, Auxin Solar (a small U.S.-based panel assembler) filed new round of antidumping/anti-circumvention (AD/CVD) cases against Malaysia, Thailand, and now Cambodia. In June 2022, the Biden Administration announced a 2-year tariff exemption, effectively pausing the issue.
- Section 201 tariffs: The Section 201 tariffs date back to 2018 when then President Donald Trump imposed duties on solar panels and cells for four years. In February 2022, President Biden extended the Section 201 tariffs on imported crystalline silicon solar panels and solar cells above an annual 5 GW tariff rate quota, while excluding bifacial panels and doubling the tariff rate quota for cells. Many in the U.S. solar industry saw this as a “balanced solution”.
- UFLPA: The Uyghur Forced Labor Prevention Act (UFLPA) presumes that goods manufactured in the Xinjiang region of China are made with forced labor, and the onus is on the manufacturer to prove otherwise. The Act went into effect in June 2022, and resulted in U.S. Customs and Border Protection seizing and retaining more than 1,000 shipments of solar equipment. In August, ROTH Capital Partners said over 3 GW of components were held up at Customs. It estimated that much as nine to 12 GW of solar modules could be prevented from entering U.S. markets by the end of the year.
With multiple challenges affecting the U.S. solar industry in the past year, NREL took a different tack on its annual report. Because the data is used to track long-term technology and soft cost trends to help focus R&D activities, instead of compling one set of data, NREL used two types of benchmarks—one showing short-term market distortions and the other showing impacts from longer-term technology trends.
The two types of benchmarks in the new report are the minimum sustainable price (MSP) and the modeled market price (MMP). MSP is a theoretical national-average cash price under long-term market conditions. The MSP report excludes short-term cost distortions that affected the market in Q1 2022. In contrast, the report’s MMP is an estimate of the national-average cash sales price under market conditions occurring in Q1 2022, consistent with NREL’s previous benchmarks.
“NREL’s addition of the MSP benchmark in 2022 reflects our primary goal of clarifying long-term PV technology and soft cost trends to inform research and development investments,” said Vignesh Ramasamy, lead author of the report. “It is imperative to understand what goes into the cost categories that add up to the final system costs for both benchmark types.”
For more context on the benchmark types, the chart below provides a concrete example comparing MSP and MMP for a residential PV system. Differences between the two benchmarks stem from different input parameters. Taking each of the component costs in turn: For the PV module, MSP is based on an NREL MSP model and excludes tariffs and short-term supply/demand dynamics, whereas the module MMP, based on third-party analyst data, includes costs from tariffs and supply/demand market dynamics. The inverter MSP is based on an average cost trend (excluding distorted 2022 costs) and no tariff impacts, whereas the inverter MMP is based on 2022 costs with tariff impacts. Similarly, the balance of system (BOS) MSP is based on an average cost trend that excludes 2022 costs, and the BOS MMP is based on 2022 costs. Soft cost input parameters are the same for MSP and MMP.
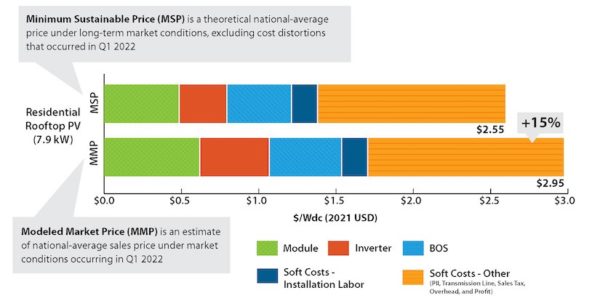
Image: NREL
NREL’s MSP and MMP benchmarks differ in both purpose and methodology. For the MSP benchmark, which is useful for long-term analysis and making research and development investment decisions, distorted input costs are removed from model calculations. For the MMP benchmark, which is useful for near-term policy and market analysis based on disaggregated system costs, reported market costs and prices of different sub-cost components are used in the calculations.
The next chart shows NREL’s MSP and MMP PV benchmarks across the residential, commercial, and utility-scale sectors. Discrepancies between benchmark types are similar for all sectors, at 13% to 15%, representing the impact of either excluding (MSP) or including (MMP) inflationary market and policy distortions. Although not shown in the chart, the differences between MSP and MMP are similar for standalone storage and PV-plus-storage systems as well.
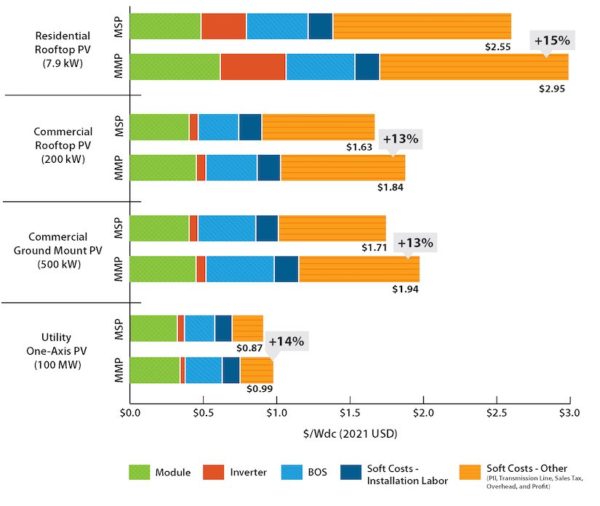
Image: NREL
Since 2010, NREL has benchmarked the disaggregated costs of PV systems, including installation costs, for residential, commercial, and utility-scale projects. In 2022, these benchmarks compare a theoretical MSP to an MMP that estimates the national-average sales price under market conditions occurring in Q1 2022. These results show the 13% to 15% difference between MSP and MMP for standalone PV systems in Q1 2022.
Because the methods used to develop the 2022 MMP benchmarks are similar to the methods used to develop NREL’s benchmarks in 2021, many of those results can be compared across years. The Q1 2022 MMP PV, storage, and PV-plus-storage benchmarks are 2% to 12% higher than comparable Q1 2021 benchmarks in real dollars. These differences could be considered estimates of the increase in national-average system sales prices between Q1 2021 and Q1 2022.
The MSP and MMP benchmarks are both based on NREL’s ongoing collection of industry data and its bottom-up cost modeling. The data include representative PV and storage system specifications based on industry trends as well as feedback from stakeholders. This year, the authors interviewed 21 stakeholders, including third-party research organizations, PV installers and integrators, EPC developers, advocacy groups, intergovernmental organizations, and government agencies.
Bottom-up modeling accounts for all system and project development costs incurred during installation, including typical installation techniques and business operations. Hardware costs reflect the purchase price of components as well as the sales price paid to the installer, including profits. The results are broken down by cost category to illustrate which system components may be driving prices and to identify opportunities for price reductions. From these same data and modeling approaches, the MSP and MMP benchmarks are differentiated by identifying cost distortions from short-term market and policy conditions and then including or excluding distorted cost inputs, as described above.
“The MSP and MMP benchmarks are simplified tools for analyzing the complex and diverse evolution of PV and storage technologies in the United States,” said Jarett Zuboy, a report coauthor. “We will continue to refine these benchmarks in subsequent reports, and we welcome feedback on our methods and results from stakeholders.”
Watch the recording from our recent pv magazine Webinar with NREL – Understanding utility-scale solar and storage operations and maintenance cost drivers
This content is protected by copyright and may not be reused. If you want to cooperate with us and would like to reuse some of our content, please contact: editors@pv-magazine.com.


By submitting this form you agree to pv magazine using your data for the purposes of publishing your comment.
Your personal data will only be disclosed or otherwise transmitted to third parties for the purposes of spam filtering or if this is necessary for technical maintenance of the website. Any other transfer to third parties will not take place unless this is justified on the basis of applicable data protection regulations or if pv magazine is legally obliged to do so.
You may revoke this consent at any time with effect for the future, in which case your personal data will be deleted immediately. Otherwise, your data will be deleted if pv magazine has processed your request or the purpose of data storage is fulfilled.
Further information on data privacy can be found in our Data Protection Policy.