Clean energy technologies such as solar and wind power are the centerpiece of a recent National Public Utilities Council report, which ranks the top 30 investor-owned utilities by decarbonization methods aimed at addressing climate change and grid resiliency.
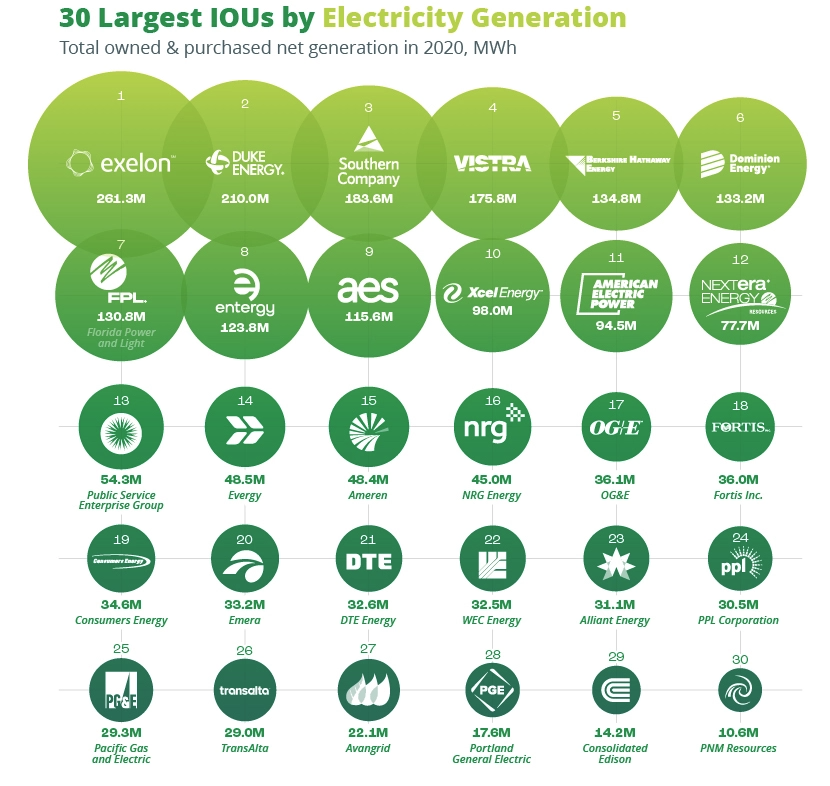
The NPUC’s Annual Utility Decarbonization Report 2022, released in conjunction with partners Motive Power and Visual Capitalist, examines the top multi-state utilities that have taken steps to buck the trend of greenhouse gas emissions with the electricity sector contributing 1.48 billion metric tons of CO2 emissions in 2020, or 25% of the emissions produced across all U.S. industries.
According to the National Oceanic and Atmospheric Administration data, over the last 40 years climate change incidents have grown six-fold, from $201.5 billion in damage from 31 storms and natural disasters from 1980 to 1989, to $1.2 trillion in damage-related costs related to 179 storms and disasters from 2009 to the present. Major milestones tracked along the previous four decades include record drought and heatwaves during the 1980’s, Midwest flooding, the growing California wildfire season, and three catastrophic hurricanes from 2005 to 2017.
With the Covid-19 pandemic dampening electricity consumption by 2.5%, nevertheless the utility market continued to generate 4 billion MWh of electricity, 61% of all electricity was generated by coal, natural gas and oil-fueled power plants.
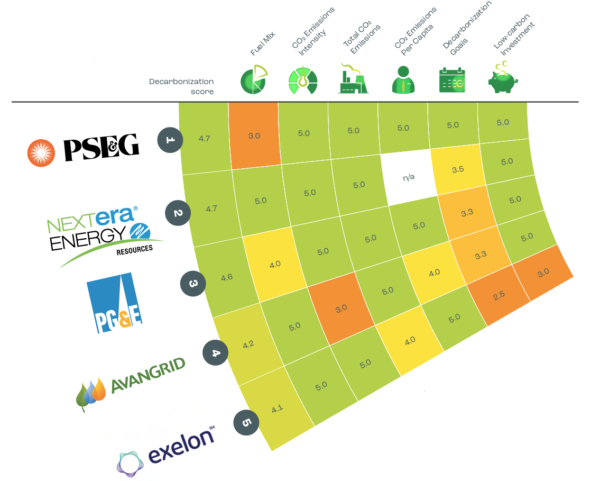
The NPUC’s decarbonization index uses six metrics to rank utilities:
- Fuel Mix – The share of low-carbon sources (renewables, nuclear and fuel cells) in the utility’s owned net electricity mix. The share of low-carbon sources can range from 0% to 100%.
- CO2Emissions Intensity – The amount of CO2 emitted per MWh of owned and purchased electricity.
- Total CO2Emissions – The sum of absolute CO2 emissions from owned and purchased electricity generation.
- CO2Emissions Per Capita – The amount of emissions from owned and purchased electricity generation per retail customer served in 2020.
- Decarbonization Goals – An evaluation of the utility’s interim greenhouse gas (GHG) emissions reduction goals and net-zero targets. The baseline is 50% GHG emissions reduction by 2030 and net-zero emissions by 2050 (utilities with baseline targets get a score of 2.5/5).
- Low-Carbon Investment – The share of planned capital expenditures (CAPEX) for electricity allocated to low-carbon sources. The share of CAPEX for low-carbon sources can range from 0% to 100%.
Utilities are scored from 1 (lowest) to 5 (highest) for each metric, while a score of close to 5 indicates utilities leading on decarbonization strategy relative to peers.
It should come as no surprise that the top 5 U.S. utilities generated 50% or more of electricity from nuclear, solar, wind power and other renewables. Public Service Enterprise Group (4.7), which services New Jersey and much of Long Island, and NextEra Energy (4.7), a Florida and Texas utility that produces its own renewable resources, were tied for the top spot. PSEG ranks highest based on its low-emissions profile and climate goals to achieve net zero emissions by 2030, or five years ahead of the Biden Administration’s target. NextEra Energy, the second highest ranked utility and owner of FP&L in eighth place, is the largest producer of wind and solar energy in the world and generated 97% of net electricity from low-carbon sources of energy in 2020.
The full list of top 30 utilities can be accessed here and it’s worth noting that several utilities tied at various intervals of the chart, with laggards weighed down by ongoing baseload generation from coal, oil and natural gas remaining in the generation mix.
pv magazine USA’s most recent ’50 States of Solar Incentives’ features highlight several utilities operating the electric grid in states with a slow-growing mix of favorable solar incentives such as Mississippi, Alabama and Tennessee. For these states, utilities Southern Company (2.3), Entergy (2.8) and Duke Energy (2.8) appear in the trailing 10 rankings on the NPUC’s Decarbonization list based on carbon metrics related to its respective power generation fleet and prohibitive policies towards solar and other distributed energy resources.
Funding and Regulatory Needs
The NPUC’s report highlights the age old challenge of achieving rapid decarbonization by 2030 requires 200,000 GW-kilometers of new high voltage transmission capacity, which steps up to 637,000 GW-km by 2050.
Similar to the Interstate Highway System that connected 48 intercontinental states by road a century ago with a $114 billion capital investment, the interstate grid will also require over 600,000 miles of transmission lines and 5.5 million miles of distribution lines to replace now 25+ year old U.S. transmission lines whose lifespan is 50 years.
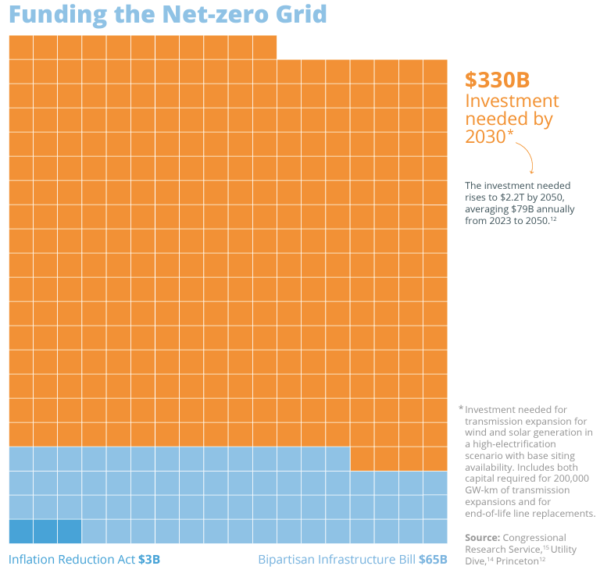
Funding the net-zero grid requires $330 billion in investment by 2030, and spikes up to $2.2 trillion by 2050, averaging at $79 billion per year from 2030 to 2050 as states commit to rapid decarbonization goals.
In order to support transmission expansion for wind and solar generation offtake, including 200,000 GW-km of new high voltage lines, state coalitions will need to come together to cover a broader industry deficit from 2030 to 2050, the report finds.
The Biden Administration’s Inflation Reduction Act puts $68 billion forward for grid infrastructure upgrades, which is just a fraction of what is necessary to the $2.2 trillion of infrastructure funding necessary to support 2050 climate change goals.
This content is protected by copyright and may not be reused. If you want to cooperate with us and would like to reuse some of our content, please contact: editors@pv-magazine.com.


Report failed to account for 40yrs increase in property values and urban spraw in vulnerable areas near flood prone waterfronts of oceans, rivers and lakes.
Sinking land is not caused by climate change and that’s added to the problem along the north east coast due to post glacial tectonic rebound in the Great Lakes region.
USA is onboard for whatever, but without China and India participating as we are, we’ll only make a small dent in the stats.