RaptorMaps, a technology-driven aerial solar inspection provider, released its annual report on data from over 20GW of inspections. The inspections span 32 countries and 66 million modules. Utility-scale, commercial, and industrial projects were analyzed in the report.
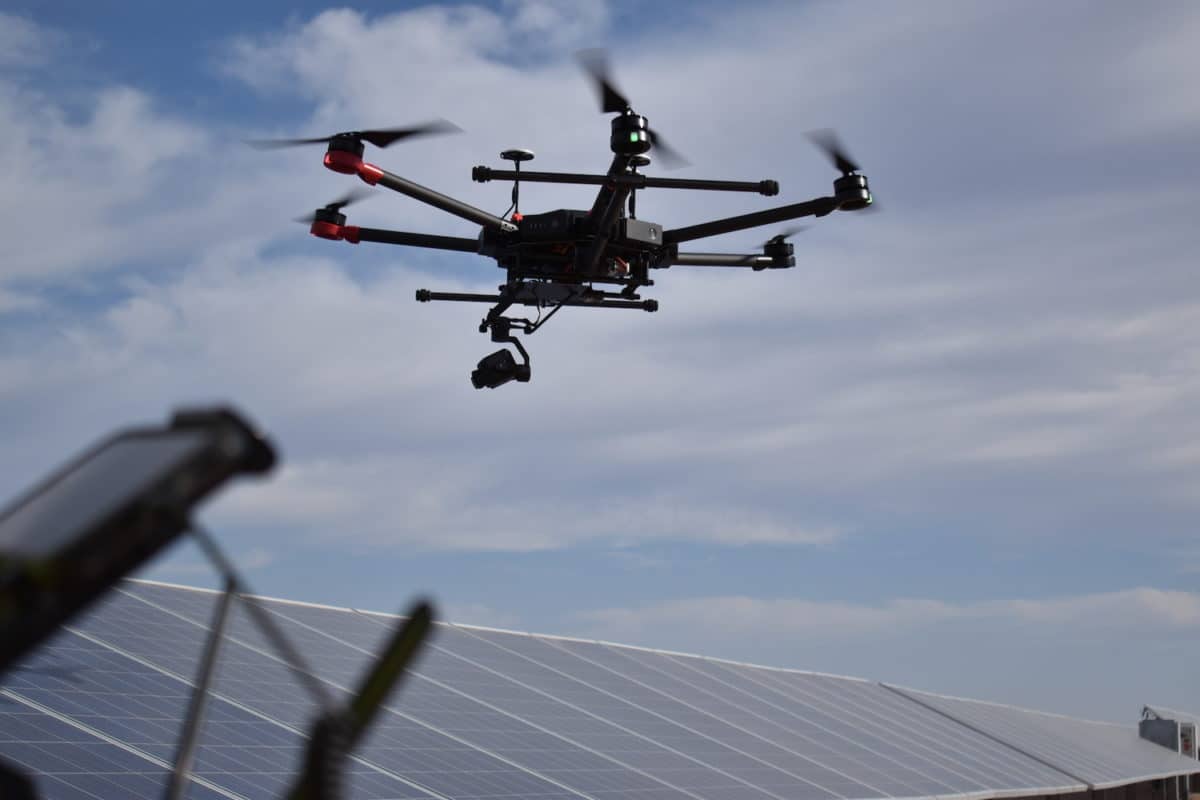
The company operates its inspections with drones or planes. Often, both thermal infrared imaging and RGB imagery are used to collect data. The company creates digital twins of solar assets to organize inspection findings and facilitate comparisons over time. The findings are identified with machine learning, which can arm solar asset managers with information to make objective, quantitative decisions based on improving productivity, power output, and return on investment.
RaptorMaps analysis found a trend of an increase in power affected by PV anomalies. Last year, 2.63% of capacity analyzed was mitigated by anomalies, up from 1.85% in 2020. This represents more than 100MW in energy production, said RaptorMaps.
The report categorized numerous anomalies, including issues in the cell, circuit, lamination, combiner box, diode, hot spot issues, short circuits, shading, soiling, physical obstructions, vegetation, string underperformance and more. Thermal imagery can more easily identify when power is properly flowing through a given component.
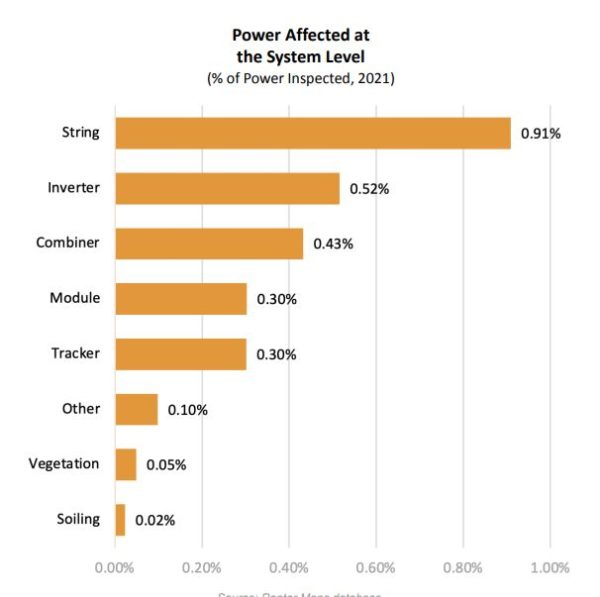
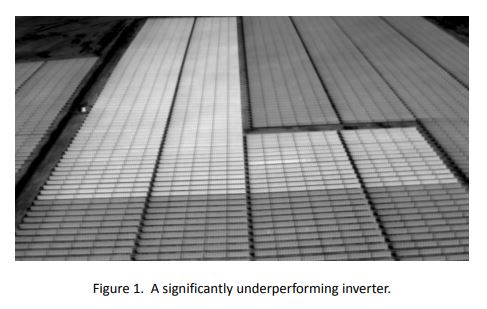
The five categories estimated to have the largest impact on energy production were strings, inverters, combiners, module-level issues and trackers. Module-level anomalies represented 11.51% of power affected, said the report.
“Our inspection data shows that solar assets are becoming more anomalous each year,” said CTO and co-founder Eddie Obropta. “These findings against the backdrop of increased costs of capital and supply chains underscores the need to use advanced technology to maximize power output. Operational excellence is no longer enough. Solar financiers, asset owners and asset managers must leverage data and analytics to make intelligent decisions that reduce soft costs.”
The report also breaks down the data on what percentage of modules are affected by a given anomaly, rather than production. It found that trackers are responsible for the most module-level issues at 1.13%, followed by strings, module-level issues, and inverters.
This content is protected by copyright and may not be reused. If you want to cooperate with us and would like to reuse some of our content, please contact: editors@pv-magazine.com.


By submitting this form you agree to pv magazine using your data for the purposes of publishing your comment.
Your personal data will only be disclosed or otherwise transmitted to third parties for the purposes of spam filtering or if this is necessary for technical maintenance of the website. Any other transfer to third parties will not take place unless this is justified on the basis of applicable data protection regulations or if pv magazine is legally obliged to do so.
You may revoke this consent at any time with effect for the future, in which case your personal data will be deleted immediately. Otherwise, your data will be deleted if pv magazine has processed your request or the purpose of data storage is fulfilled.
Further information on data privacy can be found in our Data Protection Policy.