If you want to get an idea of where the solar market in the United States is headed, a good place to start is the process every developer has to go through to plug their project into the grid. Every grid operator has an interconnection queue and you can learn a lot about where the market is going by looking at this public data.
On January 1, 2019, John Weaver and I published the first “Solar Tsunami” article in pv magazine USA. At the time we were really excited about the 139 GWac of solar that we found in the queues of six of the nation’s seven big grid operators. Even if only a small portion of it would get built, it was so much solar!
Growing 3x in 3 Years
But 139 GWac is chicken scratch by comparison to what we found at the beginning of this year. In our latest analysis, we found no less than 639 GWac of large-scale solar projects in the queues of the seven wholesale power markets, plus TVA, the Bonneville Power Administration, and two of the nation’s largest investor-owned utilities (Florida Power & Light and Southern Company). If we limit that to the queues we tracked in 2019, it still shows a more than 3x increase.
It’s important to keep in mind that this is not even all the solar projects being planned. The 639 GWac number does not include projects in the queues of dozens of other utilities across the South and Mountain West, or the smaller projects, like rooftop solar, that connect to the distribution grid. And these can add up; in California, distributed solar accounts for around 1/3 of the total capacity online.
But to understand these numbers, you have to also keep in mind that putting a project in the queue does not necessarily mean that it will ever get built. Also, there are plenty of speculative projects. ISO-New England estimates that only 30% of the capacity in its interconnection queue gets built; Lawrence Berkeley National Laboratory, in a very detailed 2021 report, estimates that only 16% of the solar projects in grid operator queues have been completed.
Looking only at projects that have gotten approval to connect to the grid gets you closer to what might actually see built in the near term—and this still shows very big numbers. Across the queues tracked in this article, 82GWac of solar projects had been granted interconnection approval.
By comparison, the U.S. Department of Energy estimates that 15.5GWac of solar came online in the United States in 2021, and predicts 21.5GW in 2022.
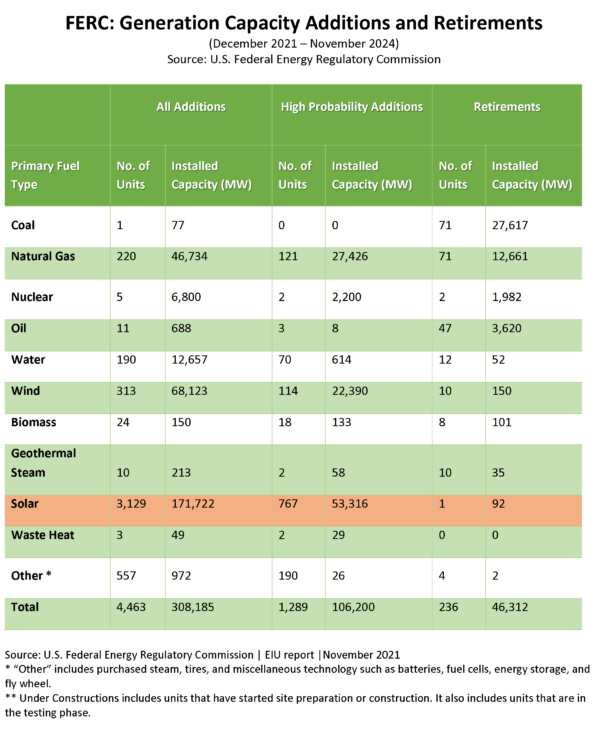
The capacity of projects with interconnection approval is also higher than the amount the Federal Energy Regulatory Commission (FERC) expects over the next three years. In FERC’s latest update, the Commission found 53GWac of solar projects with a “high probability” of getting built—far more than any other resource.
FERC doesn’t share its methodology of how it determines which projects are most likely to get built. Our team is currently developing our own methodologies so that we can offer more specific numbers in the future.
To Texas, and the Midwest
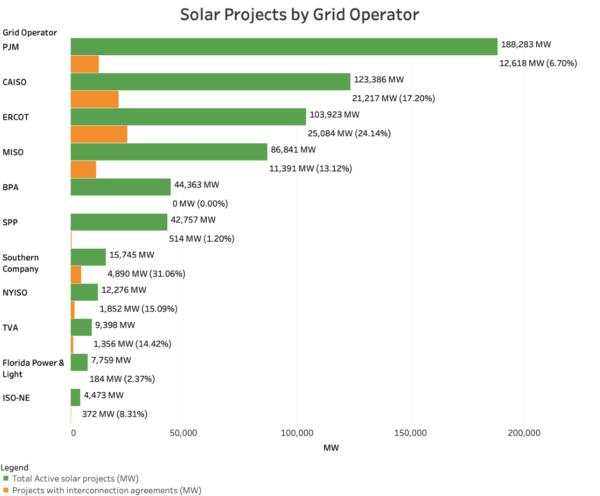
Digging into the massive volume waiting to be built also tells the story of how solar is moving beyond California to conquer the entire United States. While we don’t yet have final data, 2021 looks like the first year when Texas installed more solar than California. Even more is coming. The 25GWac of solar projects in the Electric Reliability Council of Texas (ERCOT) grid that hold interconnection agreements exceeds the California Independent System Operator’s (CAISO) 21 GW.
And the story goes beyond Texas. The Midwest and Mid-Atlantic are the new hot spots for solar development; the Midcontinent System Operator (MISO) and PJM Interconnection together have more than 26GW of solar projects with interconnection agreements.
Looking at all the active projects in the queue shows an even bigger geographical shift. PJM, the nation’s largest wholesale market, has the largest capacity in its queue and nearly 2x the capacity in ERCOT. And after these two and CAISO, MISO is in third place with 87GW.
It is important to not infer too much into the numbers of active projects, as speculative projects affect the overall size of queues, and there will be different amounts from queue to queue. Regardless, the sheer volume of projects—with nearly 2,000 active solar projects in PJM’s queue—suggests that these regions could be the next to take off in a big way.
Batteries, Batteries, and More Batteries
The second major trend documented by these queues is the explosion of the battery storage market, and in particular solar + storage. As happened with solar, California is in the lead. Not only does CAISO represent more than 1/3 of the 329GWac of battery projects (including those paired with solar*) that we found in various queues, but more importantly CAISO dominates projects with interconnection agreements. Of the 27GW of battery projects with interconnection agreements, 21 GW were in CAISO’s queue.
The only other region showing large-scale near-term battery deployment is Texas, with 4GWac of projects with interconnection agreements in ERCOT. For the other grid operators there may be many battery projects but few are ready to build; of the 78GW of battery projects in the PJM queue, only 203MW were approved for interconnection.
The biggest factor to consider here is that it takes time to move through the interconnection process. Many of these battery projects are likely simply too new to show up in the list of projects with approvals. There is also the matter that grid operators are struggling with the large numbers of solar, wind, and battery projects that are being proposed. MISO has already had to make major changes to its queue process to deal with this volume, and other grid operators are also considering doing so.
Another trend that we’re seeing is solar being paired with batteries, but this varies widely by queue. In CAISO, more than 90% of the solar projects in the queue include battery storage, whereas in ISO-New England it is around one quarter and in PJM it is 16%.
Over time, as penetrations of solar increase and policies catch up, we expect to see solar increasingly paired with energy storage, as the peanut butter and chocolate combination of the energy transition. But if California is any indication, as the market evolves there will also be many standalone energy storage projects; in California’s queue there were 270.
That’s all for the January 2022 edition of Solar Tsunami. Stay tuned, as we will be publishing another look at the queues in April, featuring expanded research to bring in more data from more queues.
Jason O’Leary, of pv-intel.com, contributed to this article with data collection, sorting, and graphics creation.
This content is protected by copyright and may not be reused. If you want to cooperate with us and would like to reuse some of our content, please contact: editors@pv-magazine.com.


“But if California is any indication, as the market evolves there will also be many standalone energy storage projects; in California’s queue there were 270”
Sustainable grid scale storage makes a lot more sense than millions of lithium batteries depreciating with each charge/discharge cycle. At grid scale we should be using flow batteries, pumped hydro, etc.
The NEM-3.0 stated goal of encouraging home storage, for example should be given a hard look… it seems like a non-goal if you actually give it any thought. Storage is a goal, but home storage with current battery tech is not necessarily good public policy.
You ain’t seen ANYTHING YET… If the US and the World is serious in SAVING 9 MILLION/Yr Premature Deaths and preventing 2 Billion from seeking Medical Intervention (from the 275 Million DALY of Suffering) due to Pollution Effects; the World/USA will need a 150/15TW Zero Pollution AgriVoltaics (AV) System producing 180,000 / 18,000 TWhrs/yr (9 Billion/450Million using 20,000/40,000KWhrs/person/yr) for ALL ITS ENERGY NEEDS…
The present Electric Grid is 3TW / 1TW handling 27,000 TWhrs / 4,200TWhrs / yr… you can see why I say .. you ain’t seens ANYTHING yet…!!!!
However, till the Biden Govt and other Nations do not agree to Eliminate Pollution (Climate Change is a small part of Pollution and the former kills and make none suffer… unlike Pollution.. but they all ignore).. Polluters will continue with their Lethal Rampage and the backlog of Utilities for Interconnection(s) will get worse… as there is no real commitment to REAL CHANGE… to enable the US Utilities to forge ahead to a 15TW, 18,000TWhrs/yr Upgrade and eliminate this backlog of Interconnections too…