We all know that our power grid is outdated, making it highly susceptible to environmental elements that could lead to interruptions or even destruction. Our power supply is also largely antiquated, relying mainly on power production that is dirty and expensive, such as fossil fuels and other non-renewables.

Solar energy is a big part of the solution to this problem, but harnessing solar energy on a large and reliable scale is not easy, especially since not everywhere in the U.S. is optimally suited for solar power production. However, as we move toward a carbon-neutral future, coal power and fossil fuels do not fit into this equation.
We believe that the levelized cost of energy (LCOE) of utility-scale solar power could be significantly cheaper than non-renewables at a cost as low as $16.89/MWh over the lifecycle of a solar power production site. Rapid advances in intelligent software and data, utilization of large-format photovoltaic modules, and two-in-portrait (2P) solar tracker designs may be the keys to unlocking maximum cost savings.
Solar adoption
The past decade has shown the energy industry a glimpse of what solar power technology can achieve. We have seen transformative price declines, allowing solar to become a viable energy source for widespread power production. While the global COVID-19 pandemic seems to disrupt all aspects of life, renewable power generation has not seen a downward trend in 2020.
Instead, costs continue to drop, along with the LCOE, bringing into the same overall range as new capacity fired by fossil fuels, such as coal. The cost reductions we are looking at are significant – between 2010 and 2020, utility-scale PV fell 85%.
Defining LCOE?
LCOE is the metric used by the energy industry to determine how long it will take to pay back the system design and installation and begin turning a profit, similar to the concept of payback in residential and commercial energy systems. The metric determines energy production needs and whether it’s viable to build and integrate into the grid, along with how much money needs to be made per unit of electricity to see a return on investment (ROI).
LCOE is made up of a numerator and denominator to determine the equation. The numerator has two specific contributors: capital expenditures (CAPEX) and operating expenses (OPEX). CAPEX is the budget spent on purchase of the equipment and the labor spent to build the power plant.
OPEX is the day-to-day costs incurred to maintain the business operations and the power plant. The numerator which is the sum of CAPEX and OPEX makes up the life cycle cost of the power plant.
Solar panels would perform best when they are perfectly aligned for optimal sun exposure in an ideal world on perfectly flat terrains. There is no way to get this type of land parcel easily; sites vary topographically and this needs to be factored into the yield algorithm at the site. Using innovations like these that account for environmental and site specific variations, we can produce more solar energy from the investment made into the plant.
To figure out the LCOE, we need to determine how much power a given system will produce for 25-30 years. This will determine the ROI (return on investment) of the plant and whether or not to move forward with the capital investments.
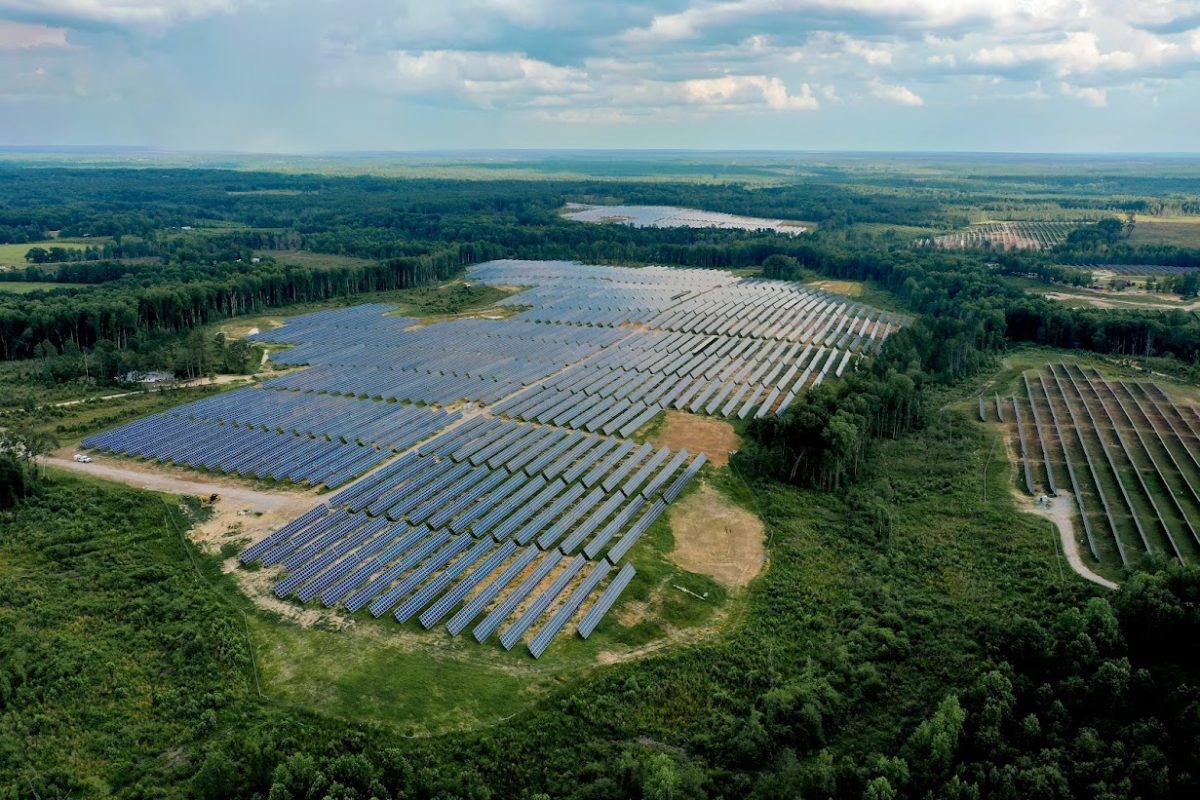
Image: FTC Solar
How to improve LCOE
To improve the overall LCOE, the CAPEX and OPEX must be reduced, while the yield needs to be increased.
The most straightforward way to reduce CAPEX is to use higher wattage modules as it drives the labor costs down, and uses less steel for racking systems, less labor for installation, less copper for energy harvesting, and less land for achieving energy targets.
To drive down OPEX, we need autonomous systems that can monitor, control, and operate energy generation for the life of the project. This would require innovation in the algorithms to respond to excursions seen at the site due to changing weather conditions, to malfunctions in the system due to aging, and any other unplanned events like fire or earthquakes. To achieve this, there has to be smart integration of sensors, drones and robots which collectively will enable high uptimes for the power plant. Underlying all of this is the data collected from the sensors that is vital to perform analytics, draw inferences, and drive course corrections.
2P vs. 1P tracking
The best way to optimize energy yields from the silicon investment is by implementing solar tracking technology, which can increase production by up to 20% simply by tracking the sun. And like most evolving technologies today, there are always concerns that need to be addressed, including how to select the best tracker design for the site.
There are pros and cons for each of these tracker types: 1P and 2P. 1P tracker has a lower height profile which is meaningful when there are height restrictions at a site. But 1P trackers are longer in length (90 meters), which can lead to layout constraints if the land is irregular in shape.
There are challenges with 2P trackers, especially when it comes to wind stability as they have larger POA (plane-of-array) area and hence have to withstand higher wind loads. But the current state of the art of 2P trackers have successfully addressed these issues through the use of multiple mitigating strategies, including, damping technologies, locking technologies, and stowing at non-zero angles. Whichever strategy is used, these have to be validated through wind-tunnel studies and field-experiences.
To see solar power reach its full potential, LCOE must be optimized to prevent a slow-down of adoption. We need to use all of the tools at our disposal to drive down the CAPEX and OPEX.
Through the application of 2P technology and our innovative trackers, FTC Solar demonstrates that we can reduce installation costs (CAPEX) and optimize solar production (OPEX) by using machine learning to maximize tracker efficiency.
Nagendra Cherukupalli is CTO at FTC Solar and is responsible for the Voyager tracker system including structures, controls and software. He has spent the last dozen years in the renewable energy space as CTO at several companies, where he has been responsible for overseeing innovation. Nagendra is a Senior Member of the IEEE and holds Master’s and Ph.D., degrees in Computer Science from IIT, Chicago and is a graduate of the Stanford Executive Program.
The views and opinions expressed in this article are the author’s own, and do not necessarily reflect those held by pv magazine.
This content is protected by copyright and may not be reused. If you want to cooperate with us and would like to reuse some of our content, please contact: editors@pv-magazine.com.


By submitting this form you agree to pv magazine using your data for the purposes of publishing your comment.
Your personal data will only be disclosed or otherwise transmitted to third parties for the purposes of spam filtering or if this is necessary for technical maintenance of the website. Any other transfer to third parties will not take place unless this is justified on the basis of applicable data protection regulations or if pv magazine is legally obliged to do so.
You may revoke this consent at any time with effect for the future, in which case your personal data will be deleted immediately. Otherwise, your data will be deleted if pv magazine has processed your request or the purpose of data storage is fulfilled.
Further information on data privacy can be found in our Data Protection Policy.