Lawrence Berkeley National Laboratory (LBL) released its annual Tracking the Sun report, a review of project-level data for nearly 2.2 million solar systems installed through year-end 2020. The report digests pricing and design trends for the sector.
System Characteristics
LBL found that PV systems continue to grow in size. Average sizes in 2020 reached 6.5 kW for residential systems, and 42 kW for non-residential systems. Twenty percent of non-residential systems were sized at greater than 200 kW in 2020.
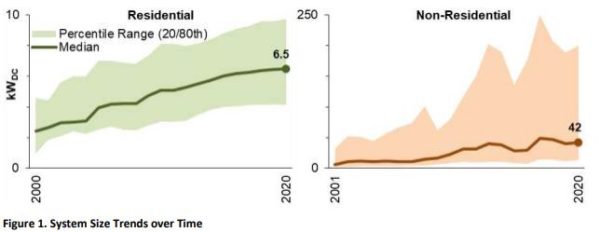
Image: Berkeley Labs
Module efficiencies have risen over time, as well. In 2002, median module efficiencies for the residential sector were 13.4%. Now, they are 19.8%.
Battery storage attachment rates for the residential market have been on a steady upward trend, reaching 8.1% of the full data sample in 2020. Non-residential attachment rates were a bit lower, and have fluctuated over the years.
Module-level power electronics (MLPE) such as microinverters or DC optimizers have gained share, and 94% of residential systems were found to be using MLPE. Small non-residential solar was equipped with MLPE in 71% of installs, and large non-residential systems used MLPE at a rate of 26%.
Third-party ownership, such as a solar lease or power purchase agreement, has been on a decline in the residential group, having reached a peak in 2012 at 59%. In 2020, the percentage had fallen to 35%. In general, LBL said that states with richer incentives typically had a higher rate of third-party-owned solar systems.
Installed prices
Over the long run, U.S. median installed prices have dropped by roughly $0.4/W per year, but that price decline has tapered off since 2014. The rate of decline has eased to about $0.1 to $0.2/W each year. Between 2019 and 2020, median prices for residential systems remained relatively flat at $3.8/W. Non-residential projects recorded a price drop of $0.2/W over that same period.
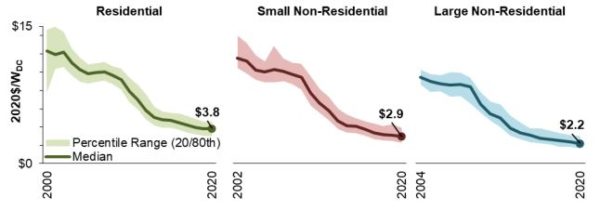
Image: Berkeley Labs
The interval between 2019 and 2020 also experienced a slight uptick in soft costs, reversing the trend of an annual reduction on the order of $0.1 to $0.2/W. On a state-by-state basis, price variations ranged widely. For example, there was a $0.5/W soft cost rise for Wisconsin and a $0.3/W drop in Delaware.
The U.S. has some catching up to do in price reduction, as median prices were nearly double that of other countries. The $3.8/W price well exceeded Germany and Australia, which have $1.6/W and $1.2/W median prices, respectively.
Installed prices within each customer segment varied depending to a large extent on system size. LBL reported a difference of $1.1/W in median prices between the smallest and largest residential systems, and $1.9/W between the smallest and largest non-residential systems.
Ground-mounting was shown to have a notable effect on installed price, adding an average of $0.40/W. The report said, however, that this solution is relatively uncommon in the residential sector. Other price effects included premium efficiency modules (+$0.14/W), microinverters (+$0.14/W), DC optimizers (+$0.24/W), and new construction (-$0.08/W).
This content is protected by copyright and may not be reused. If you want to cooperate with us and would like to reuse some of our content, please contact: editors@pv-magazine.com.


By submitting this form you agree to pv magazine using your data for the purposes of publishing your comment.
Your personal data will only be disclosed or otherwise transmitted to third parties for the purposes of spam filtering or if this is necessary for technical maintenance of the website. Any other transfer to third parties will not take place unless this is justified on the basis of applicable data protection regulations or if pv magazine is legally obliged to do so.
You may revoke this consent at any time with effect for the future, in which case your personal data will be deleted immediately. Otherwise, your data will be deleted if pv magazine has processed your request or the purpose of data storage is fulfilled.
Further information on data privacy can be found in our Data Protection Policy.