
Solar capacity factors and cost projections for projects in 10 zones that present different solar resource profiles are now available from the National Renewable Energy Laboratory’s Annual Technology Baseline.
The 10 zones correspond to the nine color bands on NREL’s map of global horizontal solar irradiance. In this case, zones 9 and 10 represent split of the map’s northernmost color band.
NREL developed the baseline products to develop and document transparent, normalized technology cost and performance assumptions; document potential pathways for impacts of R&D on renewable energy technologies; enable consistency in technology assumptions across analysis projects; facilitate the tracking and sourcing of input assumptions; and reduce the lead time required when conducting scenario analysis.
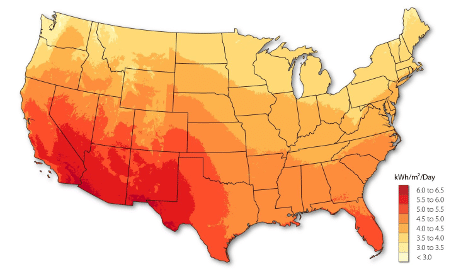
Image: NREL
In the latest update, zones 2-8, representing all but the northernmost states in the continental U.S., solar installations have a capacity factor that is at least 70% of that in the desert Southwest’s zone 1, the data show.
The solar capacity factor for each zone is provided in NREL’s tables for utility-scale, commercial and residential PV.
Each of those web pages also projects the levelized cost of electricity for solar projects, with projected cost declines through 2050 across all 10 zones.
One participant in a recent NREL-sponsored webinar on the updated data said that the baseline utility-scale PV costs for 2020 seemed too high, and noted a lower price attached to a recent solar power purchase agreement. NREL’s David Feldman, a senior financial analyst, responded that the levelized costs shown by NREL assume no tax credits. He said that “would explain a lot of the difference between market PPAs and our calculated levelized cost of electricity.”
NREL’s cost projections are available in the Tableau table at the top of each of NREL’s three PV web pages. Users may select the appropriate zone from a drop-down list for “technology detail.” Cost projections are also available in downloadable files.
For cases where NREL’s map is not fine-grained enough to determine the zone for a particular site, users may enter the site’s location in NREL’s PV Watts Calculator, said Feldman. The site’s capacity factor is then shown and its zone can be determined from the relevant NREL table. This step is necessary for distinguishing between sites in zones 9 and 10, as the two zones are combined on NREL’s map.
This content is protected by copyright and may not be reused. If you want to cooperate with us and would like to reuse some of our content, please contact: editors@pv-magazine.com.


By submitting this form you agree to pv magazine using your data for the purposes of publishing your comment.
Your personal data will only be disclosed or otherwise transmitted to third parties for the purposes of spam filtering or if this is necessary for technical maintenance of the website. Any other transfer to third parties will not take place unless this is justified on the basis of applicable data protection regulations or if pv magazine is legally obliged to do so.
You may revoke this consent at any time with effect for the future, in which case your personal data will be deleted immediately. Otherwise, your data will be deleted if pv magazine has processed your request or the purpose of data storage is fulfilled.
Further information on data privacy can be found in our Data Protection Policy.