
The latest edition of the the U.S. Department of Energy’s Energy Information Administration’s (EIA) Monthly Solar Photovoltaic Module Shipments Report, shows that, after a slow start to 2020, a record amount of modules were shipped in March. After that and amid Covid, however, April shipments dropped off considerably.
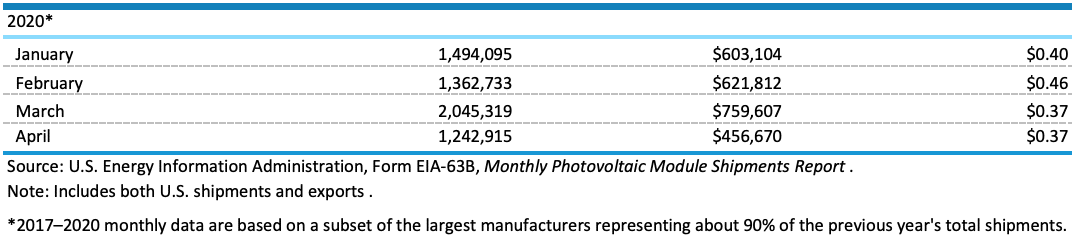
2.05 GW of modules were shipped in March, breaking the previous monthly record of 1.96 GW, set in December 2019. The success was short-lived and all but certainly virally interrupted, as in April, that shipment figure plummeted nearly 50% to 1.24 GW, the lowest mark since November 2019. Even in a downturn, March and April continued the streak of over 1 GW shipped, which has happened every month since May of 2019.
A year of fluctuation
This consistent uptick in shipment coincides with both the ITC step-down that began in 2020 and developers recognizing the potential for supply chain disruptions as the threat of Covid-19 became more and more real. In terms of the ITC, projects were able to quality for the full 30% ITC if they started physical work by the end of 2019, while developers were able to lock in the 30% ITC through a safe harbor provision, by paying for 5% or more of the cost of a project. Considering that modules represent more than 5% of total project costs, securing modules was a safe way to ensure the full ITC.
In March, California led the way, as it always does, with 693 MW of modules shipped, followed very surprisingly by Tennessee, which shipped 144 MW. You may remember that Tennessee was also on the top-5 for shipments in January and February, yet those two months combined came out to 143 MW shipped. Any other year, Tennessee’s newfound commitment to solar would be one of the more noteworthy stories, but 2020 has been home to more than its fair share of strange occurrences.
Rounding out the top-5 for March comes Massachusetts with 128 MW, Texas with 108 MW and New Jersey with 99 MW. In April, the leaders were California with 418 MW, Massachusetts with 102 MW, Tennessee with 74 MW, Florida with 48 MW and Idaho with 40 MW. It should be noted that the April shipment data for Texas has been withheld thus far.
Price per watt on the decline
March and April also featured the lowest cost per watt in the history of the report. Both months featured an average cost per peak watt of $0.37, edging out the previous record of $.038, set in June 2019. The mark is also down considerably from February’s average price of $0.46 cost per watt, which was likely due to fears of Covid-related supply chain disruptions. The $0.09 drop in average price from February to March is the largest one-month margin of decrease since March-April of 2017, when the average price fell from $0.66 to $0.42 per watt
This content is protected by copyright and may not be reused. If you want to cooperate with us and would like to reuse some of our content, please contact: editors@pv-magazine.com.


If you compare it to 2019 same month the increases are very good:
Jan: 406,510kW
Feb: 442,273kW
Mar: 1,015,834kW
Apr: 662,979kW
Jan 2020: +1,087,505kW/268%
Feb 2020: +920,460kW/208%
Mar 2020: +1,029,487kW/101%
Apr 2020: +579,936kW/87.5%
So far, in a year of a world pandemic, the worst YoY growth is 87.5%. I am pretty sure most industries would be happy with that kind of growth. And, the worst month so far would have been the 6th best last year and #1 in 2018.