The U.S. Department of Energy’s Energy Information Administration (EIA) released the full year’s electricity generation and demand numbers in February’s Electric Power Monthly. The nation as a whole generated 4.15 TWh of electricity, down 1.2% from 2018, a change attributed to overall warmer weather in 2019.
Solar power generation grew 14.9% year-over-year, driven by photovoltaic’s 15.9% increase, as solar thermal generation fell over 10%. In total, solar power was just under 2.6% of the nation’s total electricity generation for 2019, compared to 2018’s 2.2%.
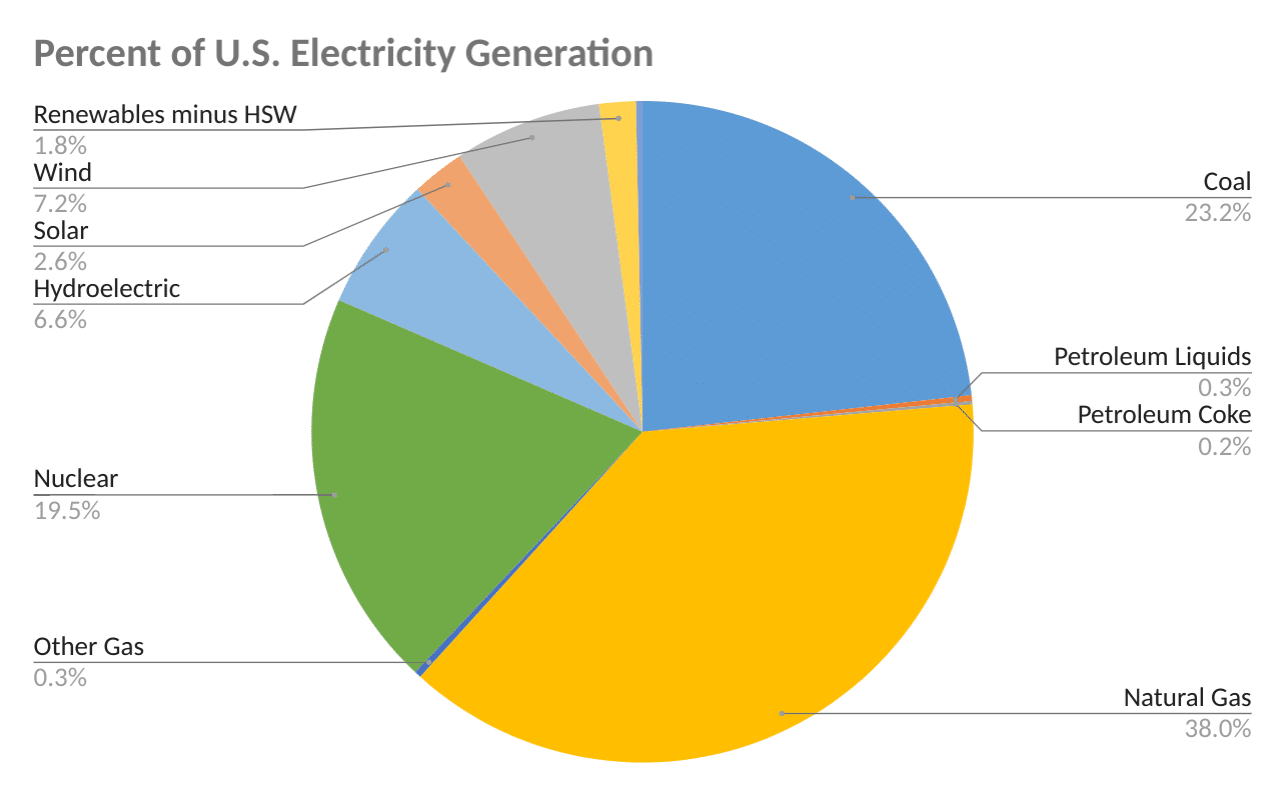
Wind and solar photovoltaic growth numbers are just starting to emerge from the depths of being no more than rounding errors on the annual report. Wind on its own, for the first time, generated more electricity than hydroelectricity in a naturally down year. Together, wind and solar made up 9.8% of all electricity generation. The pair increased their share of all generation in the U.S. by greater than 1% in a single year.
The greatest factor towards electricity’s nearly 10% lower U.S. emissions in 2019 came from the ongoing shift from coal to gas. However, the duo generated 2.5% less electricity in total, with wind and solar’s growth fulfilling nearly 60% of that decrease.
The absolute increase of wind and solar generation was 38 GWh. In comparison, the decrease in overall generation was 51 GWh, with coal falling 180 GWh, hydroelectricity falling 19 GWh and gas gaining 113 GWh.
The share of CO2 free electricity generation increased by 1%, reaching 37.6%. Nuclear power made up almost 52% of the nation’s clean electricity generation, with output up a small amount.
Growth rates slowed, but are projected to jump again
While solar photovoltaic’s 15 GWh of growth in 2019 was about equal to all generation in 2015, it also represented the smallest increase since 2016, which saw a similar increase. This growth in generation is mostly based on the 11.7 GW installed in 2018, as most of 2019’s installed volume was installed in the second half of the year and much in the 4th quarter. The volume set to be installed this year won’t fully be recognized until the February 2022 report is released.
2020 is projected to be the first to blow past 2016’s 15 GW of solar power installed. If the EIA’s projections are hit, a 60% increase in capacity will be deployed over the record year. Next year is projected to grow a bit over 2020 potential record values.
This content is protected by copyright and may not be reused. If you want to cooperate with us and would like to reuse some of our content, please contact: editors@pv-magazine.com.


I am a bit skeptical about the fossils being down in use except coal, of course.. I suspect that we overlook industrial generators that are fast becoming the newest craze of late . In California, new dealerships are being formed to peddle monstrous industrial generators that can crank up to 10MW apiece.. Those are not your ordinary backyard backup generators that piddle out maybe 4KW.. You see, more businesses are fed up with peak hours when rates are jacked up by utilities that they decide to run their own industrial generators during the hours to save a lot of money. Who is counting how many gallons of diesel or gasoline or even natural gas are being consumed by them ??? I doubt anyone is counting at all. Industrial generators are competing against community solar installers and local policymakers are playing lapdogs to the whims of local beefy business guys who give barking orders around.. Everyone is installing rooftops or utilty scale farms with nothing in between like commercial rooftops , anyone? We will still have climate change as long as we still buy industrial generators.. They even offer jet engines to crank generators… Imagine that!!?? Count them !! We have enough fake reports as you can see ..
Who counts the (number of run hours) of these generator sets? In California there is a (form) that is to be filled out with the generators serial number, make and model to SCAQMD and CARB each year. If you run such a generation resource for more hours than is allowed, then you are fined. Industrial generators are not the cure for demand charges. It is coming, when the electricity market becomes a merchant marketplace, one will find the expansion of demand charges throughout the 24 hour day. Energy storage over the long term will enable smart arbitrage and erasure of demand charges.
As for a slowing down of natural gas and coal fired generation, the electric utilities have to catch up on construction of new solar PV, wind and energy storage facilities to replace fueled generation plants. It’s not going to happen overnight. I haven’t come across one article that suggests a utility somewhere in the World is constructing a Giga-watt energy storage facility, using something like redox technology or molten salt or metals technology. There’s still a lot of technology left that hasn’t been employed. It is possible right now to deploy technology that could store several days of energy for use, during cloudy days, storm events, or even store generated power until a major feed is repaired. Not having to shut down online generation resources until a power corridor is put back into operation would make the grid more resilient than it is now.
Great reminder of how much growth/money to be made there is in solar. It’s going to be king and it’s only at 2.6% right now. Wow.