There’s a chance every solar panel is made to be a bifacial solar panel, because if not bifacial – then what? However, if we’re going to sell the electricity generation of a bifacial solar panel, we need be able to deliver the projected data to customers in a confident package that bankers and their risk models will approve . There is plenty of evidence (in the field in large projects and on the rooftop in smaller quantities) that the big money likes bifacial – but the tools to model are still needed by the broader industry.
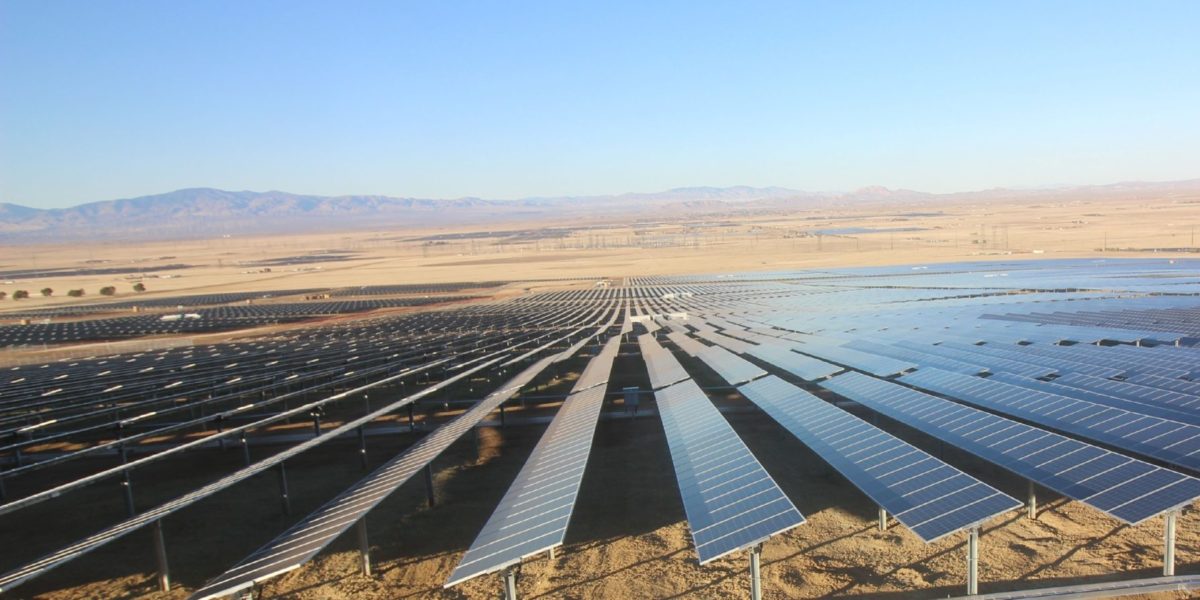
Soltec, with engineering support from Black & Veatch, have released a report, The Bifacial Year, which shows various levels of bifacial production in multiple installation conditions. Their primary note is that solar modules on a single axis tracker with two modules per row, versus a single module, can in fact generate more electricity – by 2.1% – as shown in the below image. This research opposes suggestions by other (#1 and #2) single axis tracker manufacturers.

The real meat of this analysis though actually breaks down where the additional generation comes from, as is shown in the chart below. The first data point the group shows is in agreement with prior manufacturers – if we look solely at the amount of lighting hitting the modules due to their height above the ground, there is less light hitting the modules by a very small amount.
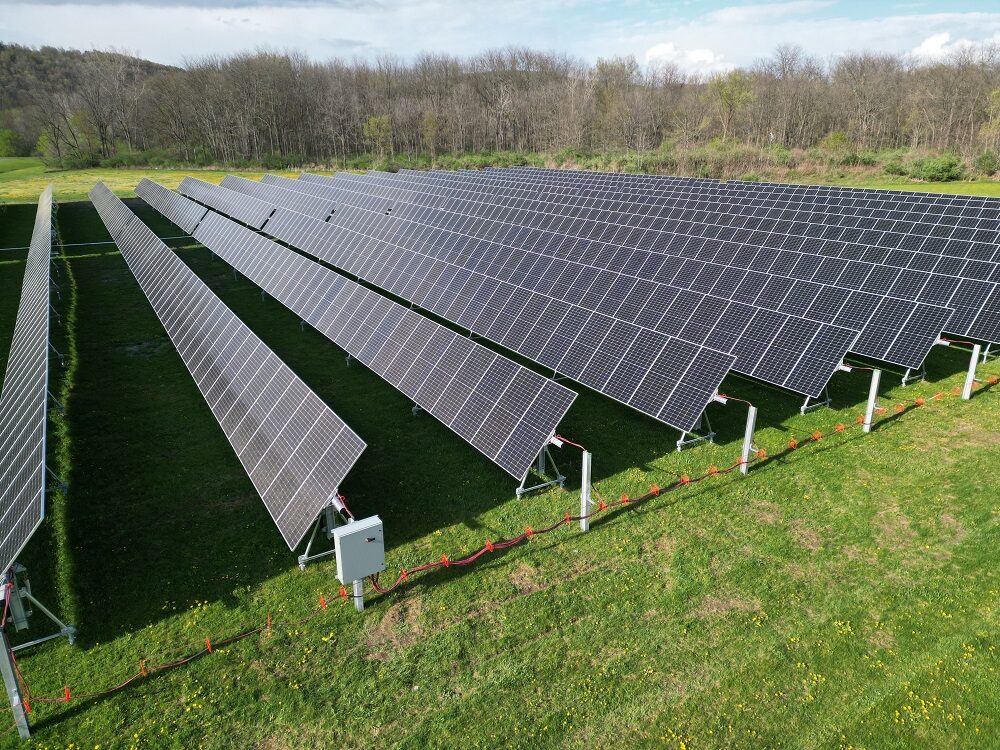
However, two other variables greatly overpower this – the design of the Soltec’s new 2P system, and for the first time seen by this author, the cooling effect of the changed module layout. The modules are cooler for three reasons in this research – 2P modules are located higher from the ground where there is more wind and thus cooler, 2P modules are spaced further apart allowing for the cooler air to dip in between rows (a sort of wake effect), and Soltec’s 2P tracker allows air to flow between the individual modules. The company saw a 6°C temperature difference on the upper module versus the lower.

The document also gives very useful tips on how to model 1P versus 2P installations in industry standard modeling tool PVSyst. For instance, they deliver these PVSyst parameters – Uc=31 W/m2 k and Uv= 1.6 W/m2 k/m/s – to help model the air flow differences. The document delivers other variables at various points of the report to help engineering groups properly model, and this author is sure that prospective buyer of their hardware could contact the manufacturer to gain greater design insight, and a large enough purchase could surely get a design.
And just to add another variable to your modeling – and maybe a motivation to DC couple energy storage – as greater bifacial gain from albedo leads to greater solar module productivity, solar inverters will begin to feel clipping stress at a sooner point if we measure system’s DC size based solely on front side module wattage. And if we also oversize our DC to AC module ratio (something this author loves seeing), then we see in the below chart how quickly the clipping gets going on a high albedo surface in a 1.5:1 DC to AC setting.

This content is protected by copyright and may not be reused. If you want to cooperate with us and would like to reuse some of our content, please contact: editors@pv-magazine.com.


By submitting this form you agree to pv magazine using your data for the purposes of publishing your comment.
Your personal data will only be disclosed or otherwise transmitted to third parties for the purposes of spam filtering or if this is necessary for technical maintenance of the website. Any other transfer to third parties will not take place unless this is justified on the basis of applicable data protection regulations or if pv magazine is legally obliged to do so.
You may revoke this consent at any time with effect for the future, in which case your personal data will be deleted immediately. Otherwise, your data will be deleted if pv magazine has processed your request or the purpose of data storage is fulfilled.
Further information on data privacy can be found in our Data Protection Policy.