We write about gas and peakers vs solar and storage a lot here – first talking about how they can absolutely compete, then how states are forsaking gas and coal, afterwards how solar+storage is the peaker, and then we dream about the solar+storage 24 hour power plant. Specifically, the peaker market is an important segment offering many gigawatts of opportunities, enough to allow for the significant scaling that can allow solar to move into many terawatts deployed.
The U.S. Department of Energy’s (DOE) National Renewable Energy Laboratory (NREL) has released a paper, The Potential for Battery Energy Storage to Provide Peaking Capacity in the United States (pdf), which shows the potential for energy storage to replace gas peakers without wind and solar, and then how the volume actually increases as solar penetration goes beyond a 10% market share and reshapes the electricity demand curves.
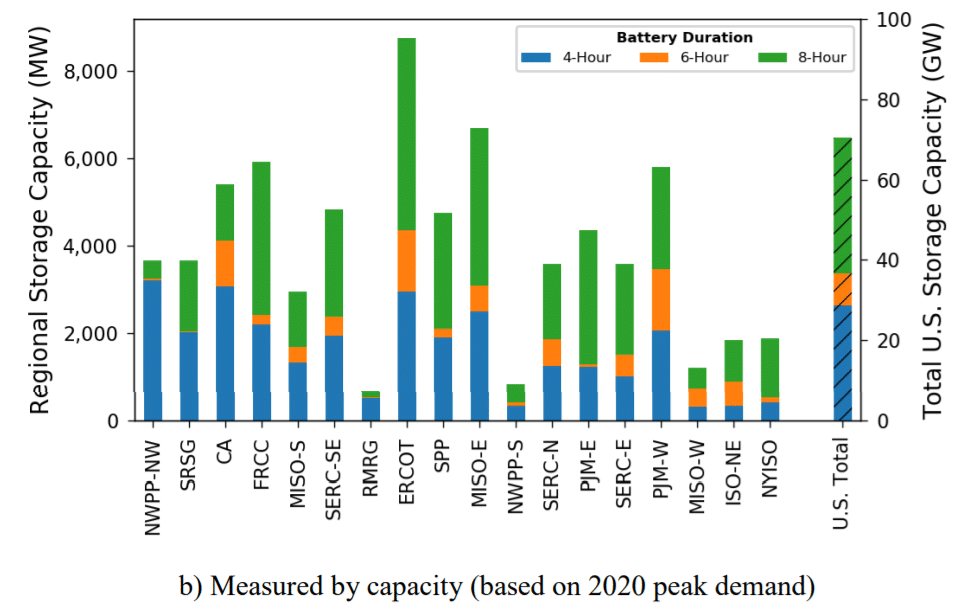
First, in a market in which no wind and solar are deployed (based on 2011 data), NREL shows a potential (above chart) for 28 GW / 112 GWh of 4-hour energy storage to replace power grid demand – without wind or solar power. When moving to six hour peaker plants the volume increases by 8 GW / 48 GWh, and then a 34 GW / 272 GWh bump at eight hour peaker capacity – totaling 70 GW / 432 GWh of energy storage opportunity to replace gas peaker plants in a no wind/solar environment .
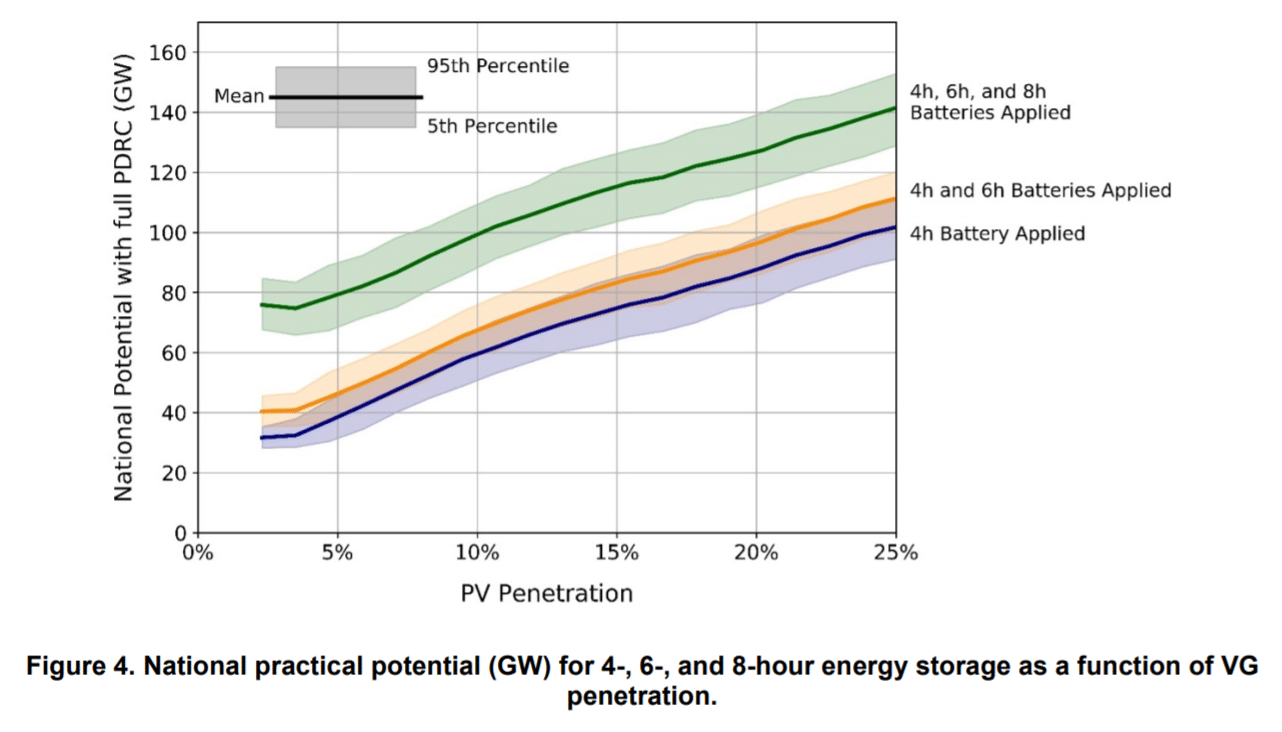
But then something magical happens as solar penetration grows from below 5% to 10%, and then 20% in the above gif (found in the paper Powerpoint Presentation (pdf). First – 4 hour energy storage opportunities quickly double from 28 GW to 60 GW at 10% solar penetration. Then, as solar grows toward 25% penetration, we see roughly 104 GW / 408 GWh in the four-hour peaker market arise. The six- and eight-hour volumes stay roughly the same – giving us a total opportunity of 144 GW / 728 GWh of energy storage replacing four, six and eight hour gas peaker plants.
This analysis looked at various state and regional markets in the USA to build a total blended volume.
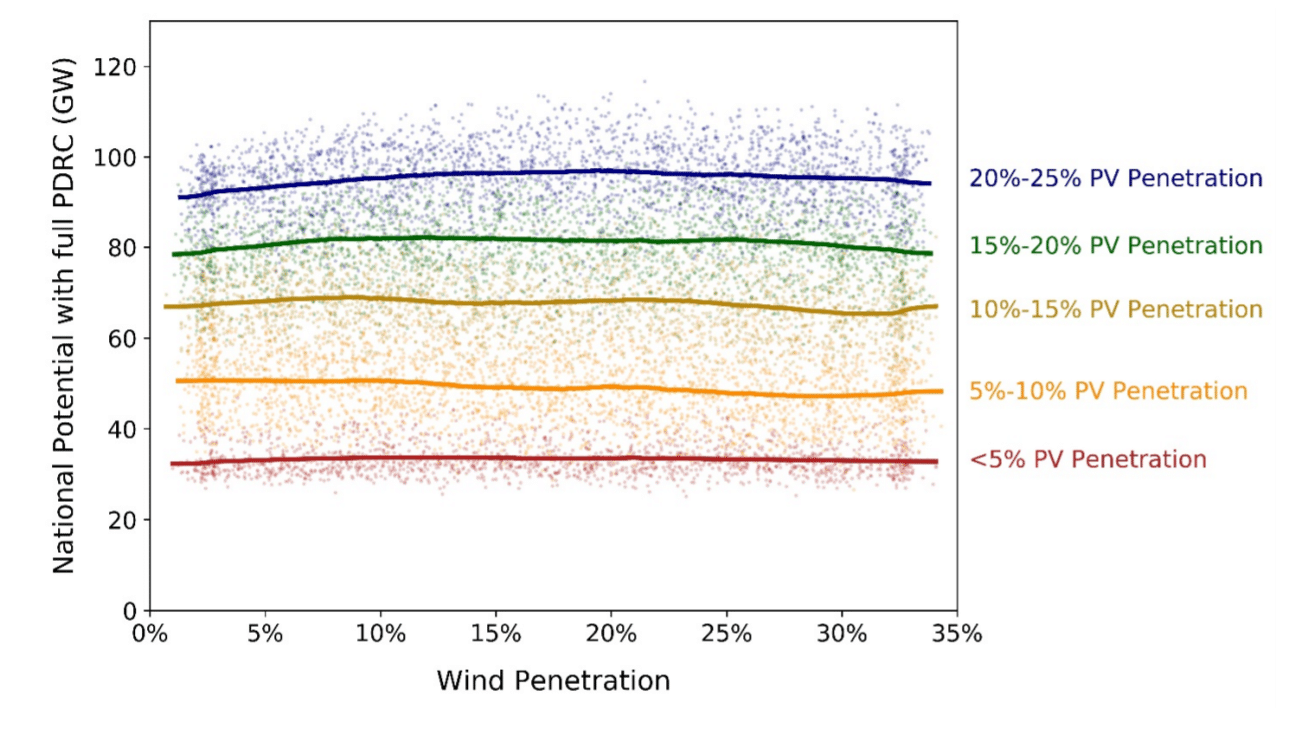
The chart below shows “national practical potentials for 4-Hour, 6-Hour, and 8-Hour storage as a function of wind penetration.” The chart even breaks out mixing in solar at various levels – with the flat lines going left to right representing increasing wind. The NREL analysis notes that, “there are no clear trends, which reinforces the finding that increases in the potential for storage will be driven more by PV than by wind.”
For perspective’s sake, in 2018, the US market installed approximately 0.311 GW / 0.777 GWh of energy storage, and WoodMac projects that by 2024 this will grow more than 10x, as they see 4.5 GW / 11.3 GWh. Other lower probability pipelines suggest far larger – with 33 GW seen on the books.
Edit: added .gif
This content is protected by copyright and may not be reused. If you want to cooperate with us and would like to reuse some of our content, please contact: editors@pv-magazine.com.


Excellent info and graphics. Thanks.
What is your take on hydrogen technology on heating and storage market ?
Under the 24/7 energy management
Once Tesla launch their Electric Cars, then the Electricity Supply for Solar would have to face challenges.
Nice post. Keep it up
thank you