
Rate design is the process by which electric utilities are attempting to restructure their revenue streams in light of an evolving marketplace for electricity. In California, customers that have solar power are now on time of use schedules, and this has led to a boom in energy storage (along with storage incentives and many other solar supporting measures).
We Energies, a utility serving Wisconsin and Michigan’s Upper Peninsula (home of some of the nation’s most expensive electricity), has filed (pdf) to increase the residential fixed charge from $16 to $17.65 / month (10.3%), and seeks to charge an additional fee of $3.53/kWac every month for on its residential customers who utilize solar power.
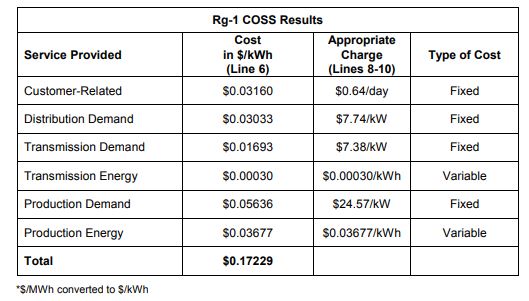
The electric utility, as part of its rate filing, broke down the standard residential solar power customer electricity costs, that are just over 17¢/kWh (above), as if it was a commercial customer bill. The utility suggested that its Cost of Service Study (COSS) states that “of all the costs to serve our residential customers, 78% are fixed and only 22% are variable.”
For an average sized residential solar power installation of 6 kWac / 7 kWdc, that covers 100% of the home’s annual electricity use, and has a 14% AC capacity factor (as noted in the filing), this fee represents approximately 24% of the variable monthly charges (see calculations in Google Drive).

It should be expected that utility scale generators will battle with distributed generators in some markets; however, there are definitely a variety of responses going on in the 50 unique state energy markets of the United States:
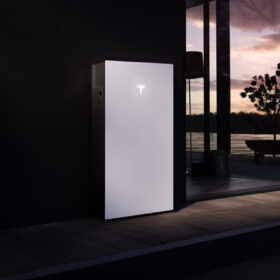
- Green Mountain Power recently started a program to include two Tesla Powerwalls in the home of 250 customers for $30 a month
- California noted $2.6 billion in transmission and distribution savings partially due to distributed solar.
Of course, it is very clear that the utilities are doing hard math on the value of solar power as Wisconsin regulators are reviewing more than 4.6 GWac of solar in more than two dozen utility scale projects.
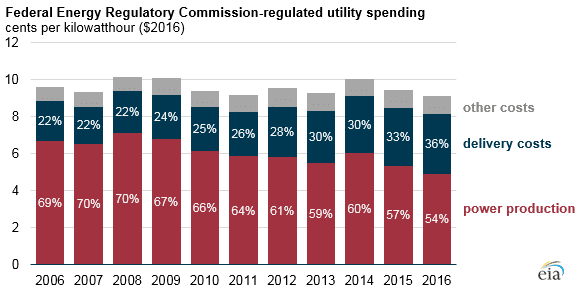
In recent years, as electricity use has flattened since around 2007, utilities have shifted from building new generation resources to increasing their investments in transmission and distribution (below) of the generated electricity. This has meant that what utilities charge for has shifted from peaking at 70% due to generation, to 54% in 2016.
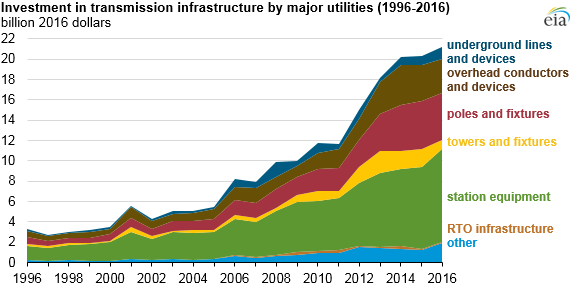
Transmission investment has grown from approximately $8 billion in 2007, to about $21 billion in 2016.
Some would suggest that this shift is a technique to enable further “gold plating” by the electric utilities in order to keep their guaranteed profits up while falling pricing from wind and solar eat away at generation revenue.
This content is protected by copyright and may not be reused. If you want to cooperate with us and would like to reuse some of our content, please contact: editors@pv-magazine.com.


We Energies tried this several years ago, and lost in court. They completely neglect the value of distributed solar to their system (and other customers) during peak generation, and of reliability and reduced demand for added production and transmission. A study they did back in 2008 even showed this, so they buried it.
Once again, utilities more concerned over lining their and their shareholders pockets than the customers they are supposed to be serving.
The state of Georgia has the same situation with its number one power supplier Georgia Power / Southern Company.
I have worked in the solar power industry for 30 years. And I’ve been fighting the utilities the entire time. I figure we’ll have to continue this fight for another 15 years. But we will win in the end. Efficiency always wins. Maybe SMUD in California could be considered cooperative but I think they’re the only ones in the entire United States. There are two camps in solar power industry these days. One camp says we should continue to work with these a**holes and the other camp says; screw them. This camp will install solar systems on houses and then just not do any interconnection agreement with local utility. No sell-back. No tax break from the government. But with lower solar costs these days, who needs it? I will use all the solar power I generate with my panels and my batteries, locally, at my house, thank you very much and bye bye. No need for the utility to be involved or a utility interconnection agreement to be signed. I can set my inverter so it doesn’t sell back. If they want to control my inverter, curtail power, shut it on and off, take power out of my battery to stabilize their shit grid, they can send me a text and then pay me dearly for that service I provide to them. I can reset my inverter for sell back (and for Sunspec communication (PLC) from the utility or aggregator). With equipment available today, I can design systems with his kind of inverter and then take my two hundred amp panel, split it into two 100-amp panels and take half (or more) of my loads offline. Why not? No hassle with the profit-mongering utilities and better payback! They wanted no subsidies (as if the oil companies and coal companies don’t have substantial subsidies buried in our taxes, Haha!) Well now they’ve got it. I thought utility companies were supposed to be thinking long-term but apparently they just think quarter-by-quarter nowadays. So, while strategic managers at the utility optimize investor profits (while the US utility business model unravels), they are simultaneously going to hear nothing but bye-bye from solar.
I have been in the utility business for the past 14 years. The people who know the least about power generation, distribution, and costing are the government utility commissioners who are supposed to regulate the monopoly big corporations. The monopolies have the regulators in their pockets. It is so easy to jack up costs (such as gold plating or 30% above market unionized salaries) and argue to the commission that they have to make a profit on wasting money and profit on inefficiency, that all you need is a half-educated fast talking English major to win your case. Now the utilities are going to monopolize the transmission and distribution networks. And again the highly paid regulators will be asleep at the switch. This is what happens when socialists and monopoly capitalists collude to kill competition.