
Sometimes life can be so very elegant.
The algorithm for replacing the coal generation with locally sourced wind and solar power has the following basic structure:
- Select the coal-fired power plant to replace
- Find the closest wind or solar resource site, limit to 35 kilometers
- Determine the generation from the wind or solar site and reduce the coal generation required to be replaced
- Save the installed capacity of wind or solar along with the levelizd cost of electricity (LCOE)
- Find the next closest wind or solar resource site
- Repeat steps 3–5 until the coal generation to replace becomes zero
- Compute the LCOE for the replacement wind or solar generation
- Repeat steps 1–7 until all the coal-fired power plants are replaced
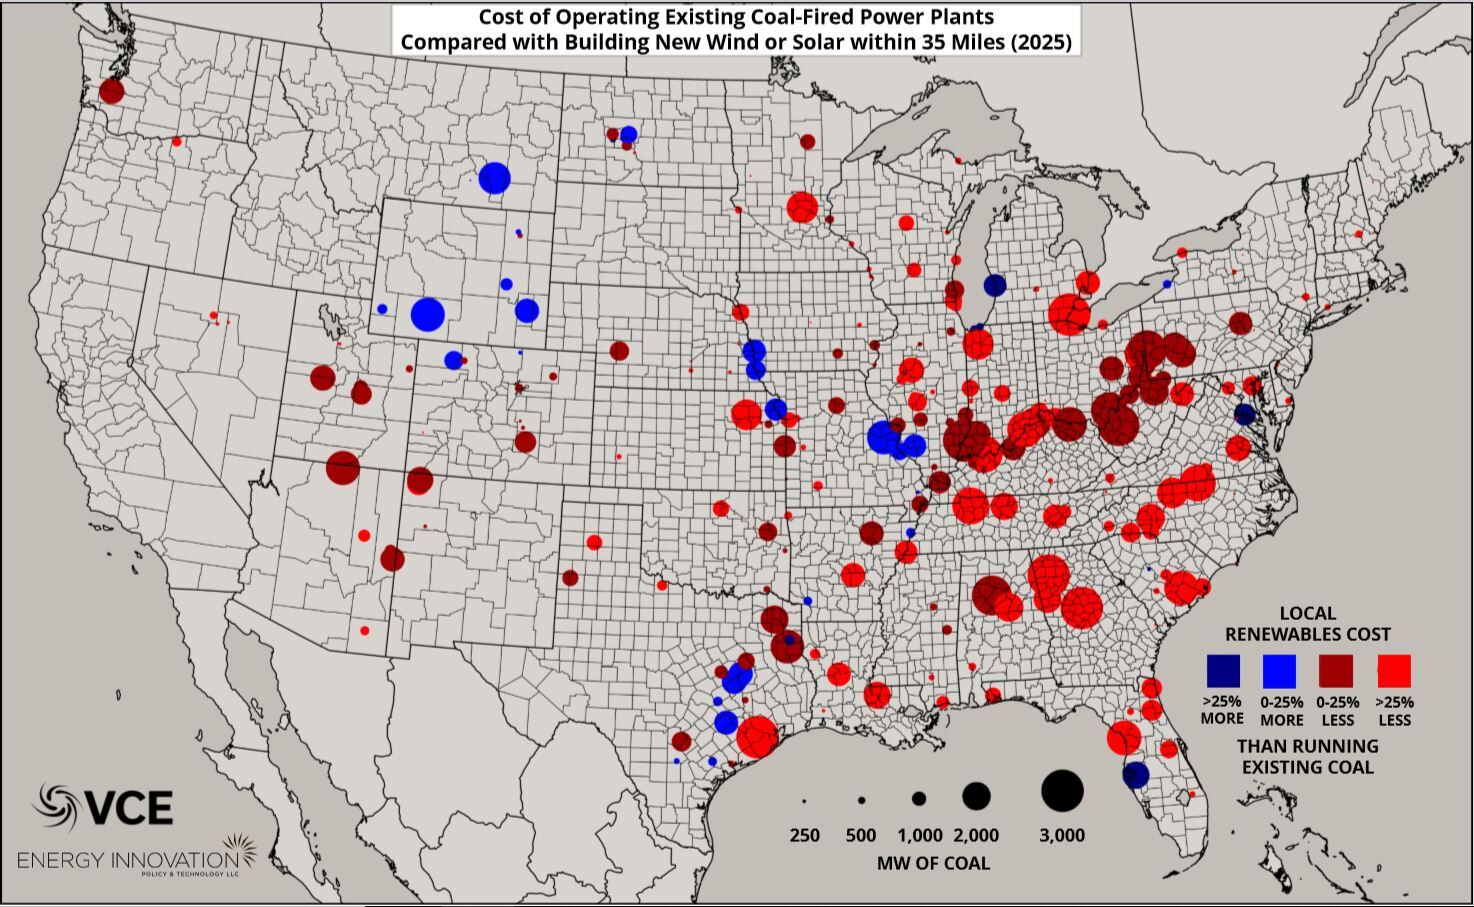
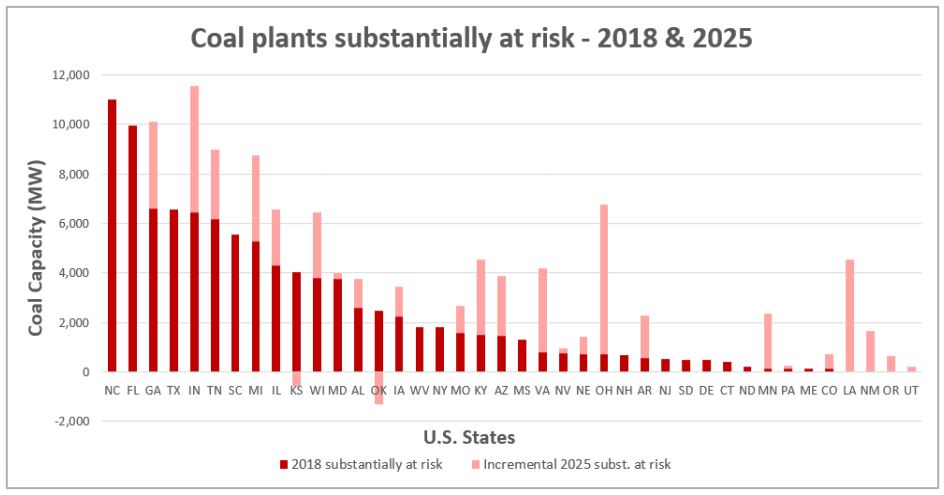
At the end of this above program running, Energy Innovation posited that right now – today – 74% of 286 GW of coal in the United States could be replaced by locally sourced (within 35 kilometers) wind and solar power, and save customers money. The document, Coal Cost Crossover (.pdf), further shows that by 2025, this increases to 86% of the coal fleet. Furthermore in 2025 there will be only 7.8 GW of coal with a 25% price cushion, versus local wind+solar.
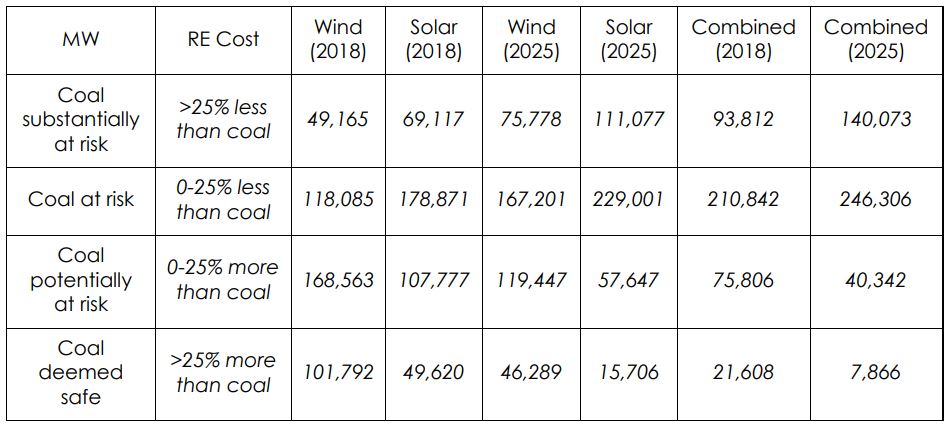
Roughly, considering a mixed capacity factor of 30% between wind+solar, the volumes of 60% capacity factor coal being retired in the “Coal at Risk Combined 2025” model above, we could expect to see close to 500 GW of wind+solar deployed.
The report also took into consideration transmission lines, their voltages, the transmission substations and their capacities. For each wind and solar site, within 3 km, the analysis looked for the nearest substation. The cost of the resource site is increased by the cost to construct the transmission line to the nearest substation. Further, if the models determine the substation is close to capacity, the sites will incur a cost to upgrade the transmission substation as well.
This analysis – with its 35 kilometer ranges – gives an amazing real-world physical quality to hard decisions that we’ve been watching come from so many, so very serious, electric utility future integrated resource plans (IRP):
- Electric utility NIPSCO announced plans to close all of its coal facilities by 2028, replacing them with solar, solar+wind, wind, demand side response and the spot market. The utility says some of the coal facilities could have stayed open past 2035, but would have cost customers millions of dollars more than shifting to new solar power.
- In this Colorado IRP, besides all the numbers being numbingly large in capacity and low in price, is the broader continued pattern of solar, wind and energy storage clearly being built in replacement of fossil fuels. In the case of Colorado, we’re actually seeing that customers will save hundreds of millions of dollars even when we’re closing coal plants a decade early – plants that are simply no longer a good economic investment.
We’ve seen Lazard’s Levelized Cost of Electricity show us the hard math that wind and solar are way out in front. And of course – the music makers – they scoff at coal, and the leading design teams inside of those firms are aiming for gas while letting business development eat up the coal opportunities that exist today.
If you were a local activist hoping to over-focus on a single topic, you could literally pick out a specific coal plant, and then find the land, the local solar developers, the finance companies, the politicians and the public utility commissions to start the movement. It’s probable that a local Sierra Club group already has each plant in their sights, so maybe you combine their knowledge with a sales team from the national wind+solar development companies. Then start contacting the local plant workers, and getting the wind and solar construction companies to start hiring.
We’ve been given a map.
This content is protected by copyright and may not be reused. If you want to cooperate with us and would like to reuse some of our content, please contact: editors@pv-magazine.com.


Since coal in the US is the fungible choice, any generation takes away coal generation.
So every RE kw installed replaces the worst polluting power.
Likely in the US in 2021 RE will pass coal in total generation, if not before showing how much RE has increased and coal has decreased.
Since the number of homes, buildings, businesses making their own for much less than retail power will explode as costs become so cheap, there really is no longer any need for new FF plants of any type as grid demand drops and more cities to states aim for 100% RE.
Since in just a couple yrs and I can do now solar, wind, CHP at $.05/kwh is available for $5k supplying a home with power and heat and the grid with backup power along with EVs generating into the grid, energy is going to change radically the next 15 yrs.