
Some projects take years to move through the interconnection queue. And it often costs thousands, or tens of thousands, to be told that your project won’t fit on the local grid for whatever reason. In markets like Massachusetts, you can then be asked to spend significant amounts of money to upgrade transformers, install new powerlines, or upgrade substations and then play the lottery that later developers take some of those upgrade costs onto their local projects. Things like this can kill the financials of otherwise viable projects.
California has taken steps to mitigate this risk by requiring electricity utilities to provide increasingly detailed maps of the grid. And the newest version of their Integration Capacity Analysis (ICA 20) maps went online as of December 28.
Here’s where these maps live:
- Pacific Gas & Electric’s (PG&E) Grid Needs Assessment (GNA) maps
- Southern California Edison’s (SCE) Distributed Energy Resource Interconnection Map
- San Diego Gas & Electric (SCG&E) Enhanced Integration Capacity Analysis page requires registration first
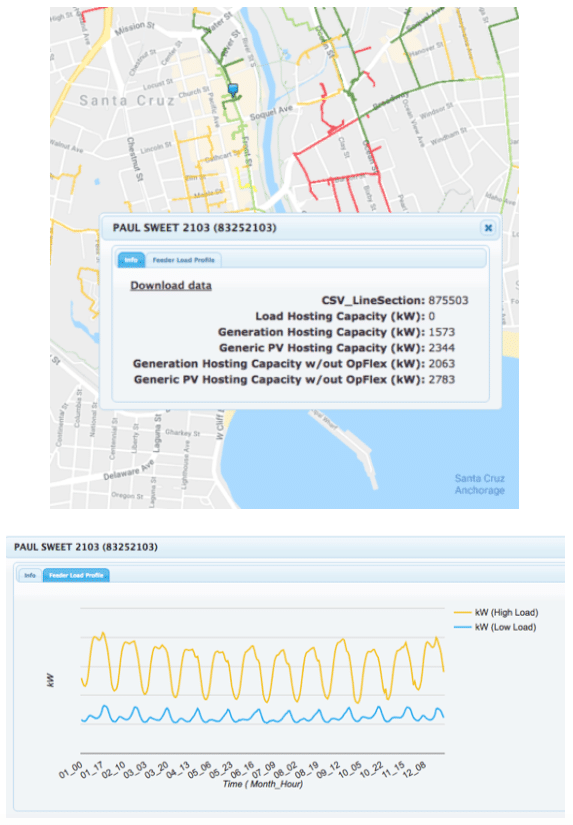
Some of the benefits of the new map structure are noted in the above image, including that they provide circuit level data as well as hourly usage rates on said circuit. Sahm White, Economics and Policy Analysis Director at the Clean Coalition noted:
A developer can now determine, early in the decision-making process, what size of project can be sited at any location with little or no modification to the existing grid. This is critical for easily choosing the best locations for siting projects, and then for projects that are moved forward, being informed with realistic costs and timing expectations regarding interconnection.
The new maps evaluate the most common interconnection capacity factors at the node level on every line section of all primary distribution circuits. Clean Coalition pointed out that level information gives insight at every point on the circuit where there can be a change in values that would affect the ICA results, which would affect how much solar can be attached.
The information will be updated monthly.
Clean Coalition told pv magazine they hope that the hourly data will facilitate even higher levels of integration from insightful developers who make use of energy storage on what might seem like a crowded circuit, but really is a circuit that just need a bit sharper analysis.
ICA 3.0 next steps have already been defined:
- Current ICA maps pertain to just the distribution grid. ICA 3.0 will add constraints related to the transmission grid that could affect interconnection — for example, other projects being proposed for that part of the transmission grid.
- ICA 2.0 maps model each circuit, but they do not show how a circuit may affect neighboring circuits. ICA 3.0 will dynamically model multiple circuits and their impact on one another.
- ICA 3.0 will aim to update the maps in real-time, to ensure that the results are never out of date.
An analysis by the U.S. Department of Energy’s (DOE) National Renewable Energy Lab (NREL) has found that pre-applications for systems 500 kWAC and greater in Massachusetts were correlated with a 24% increase in interconnection service agreements approved.
It looks like California is at least two generations of technology ahead of other states. Let’s hope the rest of us catch up, so that we have a grid that can make an asset out of every building, every battery, and every solar system.
This content is protected by copyright and may not be reused. If you want to cooperate with us and would like to reuse some of our content, please contact: editors@pv-magazine.com.


Maybe it is just me but the PG&E link returns an error and the SCE and SG&E don’t
Fixed
It’s November 2021, and PG&E’s ICA maps are still not available to the public (ratepayers). Why not?
Homeowners should not have to go through a solar developer to be able to get a sense of the risk of deploying a solar system that may not be allowed to connect to the grid.