The US Department of Energy’s Lawrence Berkeley National Laboratory (LBNL) has released the eleventh version of its annual report on solar cost declines in the Tracking the Sun series. The report covers all roof mounted systems, and also ground mounted systems from 5 kW to 5 MW-AC.
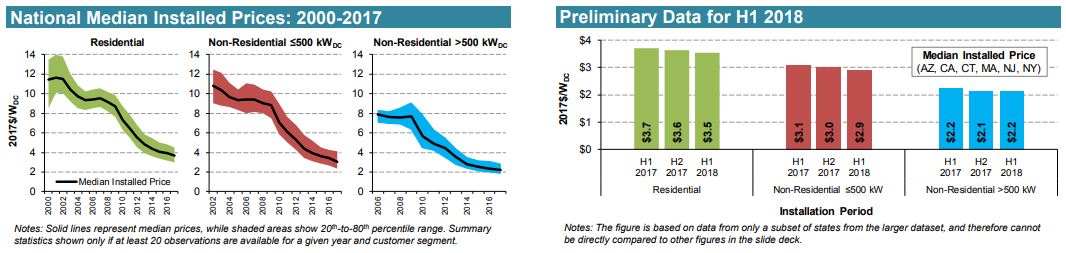
Tracking the Sun showed continued pricing declines in 2017, in line with the lighter declines we’ve seen since 2014. However, in the first half of 2018 the report showed minimal price declines in the United States.
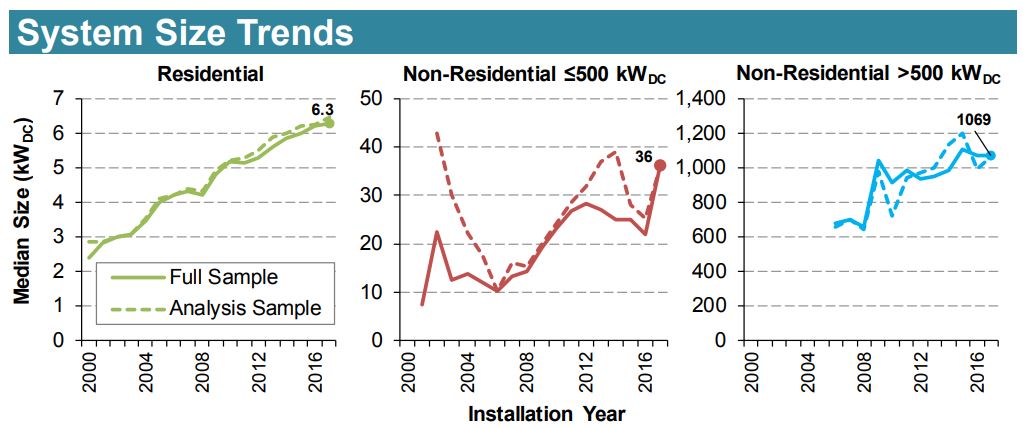
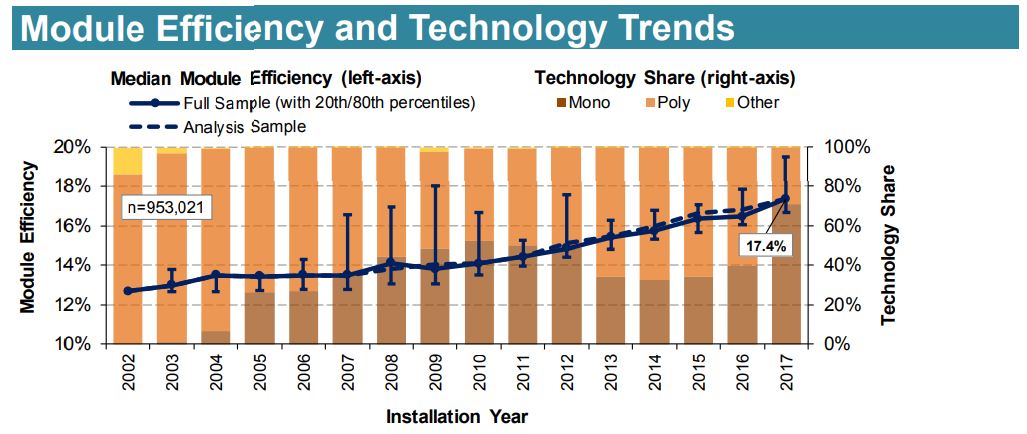
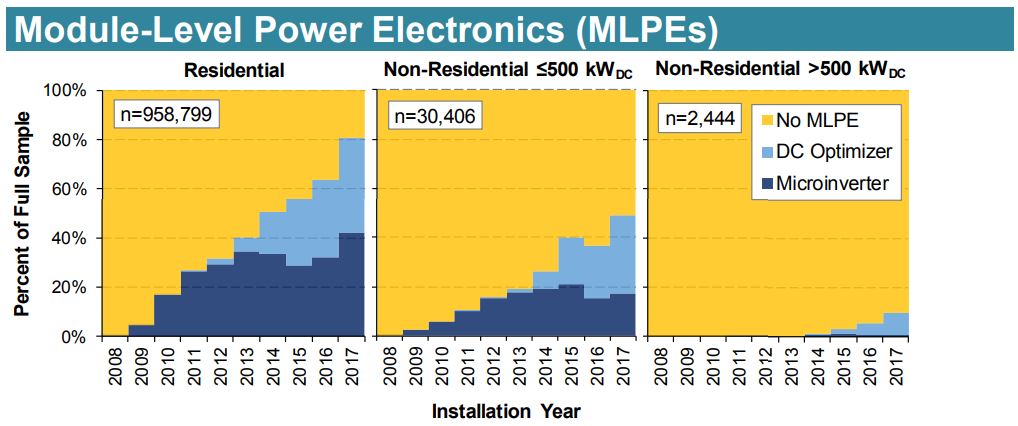
Far beyond just the pricing movements, the document is full of broad trends collected analysis of over 700,000 systems who had data available. In some of the images from the powerpoint presentation (PDF) you see residential system sizes going up, module efficiency increasing to an average of 17.4%, and power electronics dominating residential and starting to creep into commercial systems.
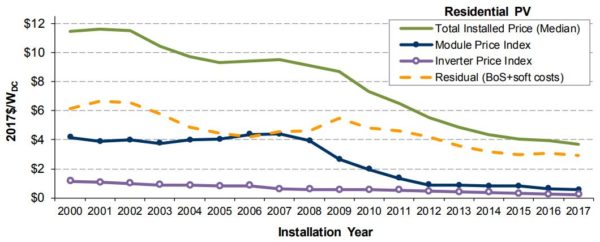
Specifically for residential projects, since the year 2000 of the total $8/W long-term decline in median residential system prices:
- ~46% was associated with falling module prices
- ~12% with falling inverter prices
- ~42% with the collective assortment of balance of systems (BoS) and soft costs
The report also notes that incentives ranging from $4-8 per watt in various locations have gone away while the pricing of systems has fallen, thus negating some of the price declines.
The report highlighted the wide variances in pricing across many market types. Some of this comes from from module types, some is state-to-state variations, and some installer preferences – and including whether systems were third-party or customer owned. The report shows a sharp uptick in residential pricing for systems using premium, high-efficiency modules.
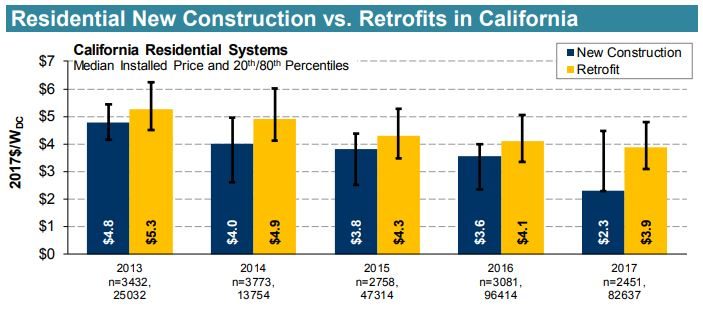
Of interest was that the new construction versus retrofit market was showing extreme evolution in California with the new construction market falling to $2.30 per watt. pv magazine projects this number is ready to hit $1.15 per watt now, and $1 per watt not soon thereafter.
The also notes that their report tends to show higher average pricing than other reporting groups because they might be bottom modeled, price quotes versus final installation costs that contain project additions. The LBNL analysis found that their reports lowest 20th percentile values tended to align with broad market surveys.
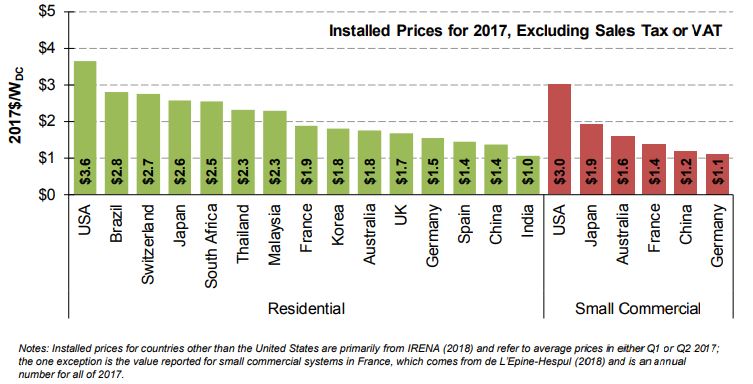
One final note that raised an eyebrow – US installation prices are far higher than international costs, suggesting there is much fat to be trimmed.
This content is protected by copyright and may not be reused. If you want to cooperate with us and would like to reuse some of our content, please contact: editors@pv-magazine.com.


Interesting!