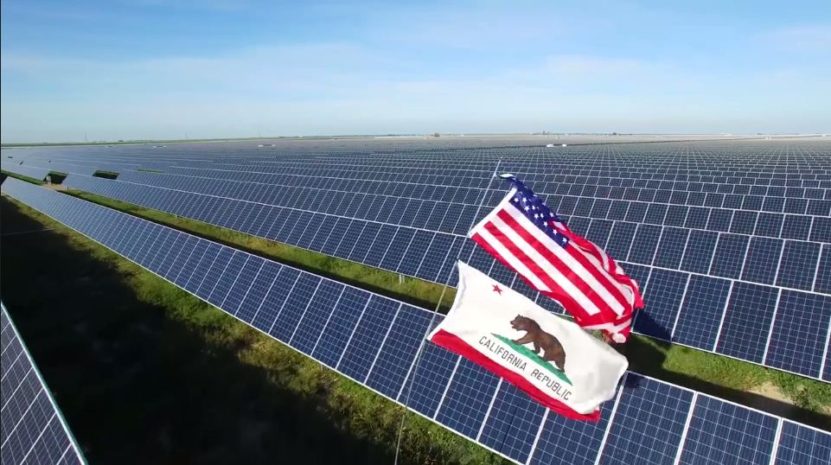
For both solar and batteries, California has led the nation and in many cases the world. The 22 GW of solar that the state has installed through the first quarter of 2018 was more than 40% of the total in the United States, and California has been by far the largest market for battery deployment.
This did not come about by accident. The world’s fifth-largest economy passed a 33% by 2020 renewable energy mandate in 2011, following this with a 50% by 2030 mandate in 2015. California also made history with AB 2514 in 2010, which led to the mandate that the state’s utilities install 1.3 GW of energy storage by 2024.
Just last month the state’s legislature upped the ante again, with SB 100 calling for 100% zero-carbon electricity by 2045, including 60% renewable energy by 2030. It also passed another piece of legislation that could be equally important for the state’s battery market: SB 700, which will extend subsidies for behind-the-meter energy storage through the Self Generation Incentive Program (SGIP).
Both of these are currently awaiting a signature by California Governor Jerry Brown (D). But as he is expected to sign them, this brings up the question of just how much renewable energy and batteries are coming as a result of this.
The numbers
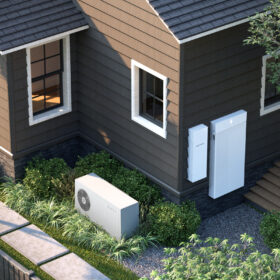
According to pv magazine’s calculations, SB 100 could spur an additional 10 GW of solar and wind by 2030. Meanwhile, California Solar and Storage Association (CALSSA) is estimating that SB 700 will spur behind-the-meter battery deployments in the 2 – 2.5 GW range through the end of 2025, and possibly more.
Among our assumptions* is that the increased RPS would be met by solar and wind, given that these two resources have dominated California’s renewable energy procurement in recent years. And with roughly twice as much solar as wind deployed to date in the state, it is likely that solar could be the bulk of that additional 10 GW.
“There just isn’t a great wind resource in California,” notes Michael O’Boyle, electricity policy manager at Energy Innovation.
As for SB 700, CALSSA is assuming that 80% of the incentive budget will continue to be dedicated to energy storage, and that the program will continue to be split between residential and non-residential storage. The organization also notes that California regulators will need to adjust the program’s incentive levels and steps, and CALSSA describes their assumptions about average incentive levels as “conservative”.
However, this may not be all the new energy storage that is deployed as a result of these two bills. As solar penetrations increase, mid-day electricity prices fall further and the cost of combining solar and storage gets cheaper, more solar installations are likely to be paired with energy storage to take advantage of higher wholesale electricity prices in the evening.
IOUs vs. CCAs
However, this new mandate and extension of SGIP will interact with a number of other complexities and changes in California’s electricity system, and many questions remain unanswered. California’s large investor-owned utilities (IOUs) have already well exceeded their mandates under the state’s 50% by 2030 mandate, with San Diego Gas & Electric Company (SDG&E) hitting 43% renewable energy as early as 2016.
The state’s growing number of community choice aggregators (CCAs), many of which are only buying renewable energy, are further accelerating the state’s transition to renewable energy, but also putting pressure on planning at IOUs.
“My impression is that procurement (at IOUs) has stalled now because of the uncertainty about how much load they will be responsible for in the future, and how much of the new load will be split among the CCAs,” Energy Innovation’s Michael O’Boyle told pv magazine.
It is also unclear how much regulators are going to allow CCAs to continue to proliferate and operate under a different set of rules than investor-owned utilities. O’Boyle points to a carbon-based integrated resource planning (IRP) effort, which will attempt to centralize statewide planning around procurement to meet the state’s carbon goals.
“The California Public Utilities Commission has stated that it is their opinion that the CCAs will have to participate,” notes O’Boyle.
Regionalization (or not)
There is also the question of what kind of wholesale market structure California – and the West – will have in the future. O’Boyle is among those who sees regionalization as key to meeting the state’s clean energy mandates.
“I don’t see really a path for California to get to it’s 100% clean energy goal without regionalization, because you need that resource and load diversity,” states O’Boyle.
O’Boyle notes that this will also affect the potential mix of wind and solar. “If we could export solar, it would reduce the downward pressure from the high share that we’ve got, and meet our goals more cost-effectively,” he explains.
And while a bill to set conditions for California to participate in a regional western grid (AB 813) failed to pass in the last legislative session, O’Boyle expects the economic advantages of regionalization to win out.
“The fundamentals of the economics of regionalization are only going to increase,” says O’Boyle. “it is going to keep pushing on the system until it breaks.”
For those readers interested in these thorny questions of the nuts and bolts of integrating high levels of renewable energy, this question will be explored in depth by a panel of experts including Michael O’Boyle at pv magazine’s Future PV Roundtable at the Solar Power International conference on September 26. The event is free, and you can learn more and register to attend here.
* Technical note: The 10 GW figure is derived California’s in-state generation of 255 terawatt-hours in 2017 (via EIA’s Electric Power Monthly), and an assumed average capacity factor (CF) of 25% for both wind and solar. This in turn assumes a 30% CF for utility-scale solar (per LBNL, and assuming virtually all large solar installations will continue to utilize tracking technology) and 16% for behind-the-meter. A continuation of the existing 2:1 ratio of utility-scale to behind-the-meter solar is also assumed. Thus difference between a 50% RPS and a 60% RPS in 2030 would yield around 11.6 GW of wind and/or solar, and as electricity demand continues to fall annually we settled on 10 GW as a ballpark number.
This content is protected by copyright and may not be reused. If you want to cooperate with us and would like to reuse some of our content, please contact: editors@pv-magazine.com.


By submitting this form you agree to pv magazine using your data for the purposes of publishing your comment.
Your personal data will only be disclosed or otherwise transmitted to third parties for the purposes of spam filtering or if this is necessary for technical maintenance of the website. Any other transfer to third parties will not take place unless this is justified on the basis of applicable data protection regulations or if pv magazine is legally obliged to do so.
You may revoke this consent at any time with effect for the future, in which case your personal data will be deleted immediately. Otherwise, your data will be deleted if pv magazine has processed your request or the purpose of data storage is fulfilled.
Further information on data privacy can be found in our Data Protection Policy.