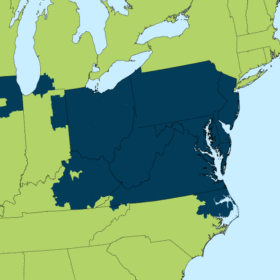
If the new data released by The Solar Foundation (TSF) this morning, which shows the solar industry having a $154 billion impact on the U.S. economy last year, can’t mobilize an army of Americans to fight for the right to control their own energy choices, then maybe the polling that shows 90% of Americans support the industry are flat out wrong.
A new interactive map – assembled by TSF from the data it collected in its National Solar Jobs Census – provides the most detailed profile yet on how much the solar revolution is affecting the United States. It breaks down the already jaw-dropping 260,077 jobs nationally into such discrete, delectable pieces it’s hard to know where to start.
Want overall national data? It can do that. State-level data? Absolutely. Metropolitan area, county, and congressional district level? Yep, yep and yep. Solar geeks will get lost in this data for hours, so go look at the map at your own risk (go look at the map – you’ll enjoy every second of it).
“The solar industry is generating well-paying jobs everywhere from Detroit to Miami to Salt Lake City, and in states from Ohio to Texas to South Carolina,” said Andrea Luecke, president and executive director of TSF. “America’s solar energy boom adds tens of billions of dollars to our economy each year, all while providing an affordable, reliable, and local energy source.”
As pv magazine reported at the time, the National Solar Jobs Census reported historic growth in the solar industry, reaching 25% nationwide. The new data reveals the growth wasn’t limited to the traditional solar states whose names everyone knows – California, Arizona, New Jersey, North Carolina and the like. In fact, the number of solar jobs increased in 44 of the 50 states from 2015 to 2016, and solar jobs grew by 50% or more in 21 of the 50 states.
Other exciting data arises from the U.S. Office of Management and Budget-defined metropolitan-statistical areas (MSA), of which there are 382 in the United States. A MSA is defined as one or more adjacent counties or county equivalents that have at least one urban core area of at least 50,000 in population, plus adjacent territory that has a high degree of social and economic integration with the core as measured by commuting ties.

Data gleaned from the MSAs revealed significant growth in many of the expected places: Texas, Florida and Georgia. pv magazine has covered the regulatory situations in Florida and Georgia extensively, and Americas editor Christian Roselund wrote the definitive piece on the Texas market in 2015. One place that was a huge surprise? My own home town of Cleveland.
According to the data, solar jobs in the Cleveland metropolitan area doubled, for a total of 1,632 solar workers in 2016. My Congressional district – the 11th – has 989 solar jobs in it alone (and I can assure you that Rep. Marcia Fudge will be getting a call from one of her most active supporters reminding her of this fact). As I mentioned earlier, solar geeks like me could find themselves marinating in this data for hours and still never get enough (I speak from experience).
The new map offers complete data on solar jobs in all 50 states, along with details on jobs by solar employment sector, percentages of women and veterans in the solar workforce, and more. And you can toggle between 2015 and 2016 data to compare the number of solar jobs year over year, watching the solar industry expand before your own eyes.
Building on the fact that the solar industry creating one out of every 50 jobs in the country last year, solar advocates across the country should mine this information, hold solar town halls and explain to audiences across the country the importance of the industry to their regions and, most importantly, their neighbors. This gold mine should be immediately used to build national support, legislative district by legislative district, in support of the solar industry. Let the map be the guide.
This content is protected by copyright and may not be reused. If you want to cooperate with us and would like to reuse some of our content, please contact: editors@pv-magazine.com.


By submitting this form you agree to pv magazine using your data for the purposes of publishing your comment.
Your personal data will only be disclosed or otherwise transmitted to third parties for the purposes of spam filtering or if this is necessary for technical maintenance of the website. Any other transfer to third parties will not take place unless this is justified on the basis of applicable data protection regulations or if pv magazine is legally obliged to do so.
You may revoke this consent at any time with effect for the future, in which case your personal data will be deleted immediately. Otherwise, your data will be deleted if pv magazine has processed your request or the purpose of data storage is fulfilled.
Further information on data privacy can be found in our Data Protection Policy.