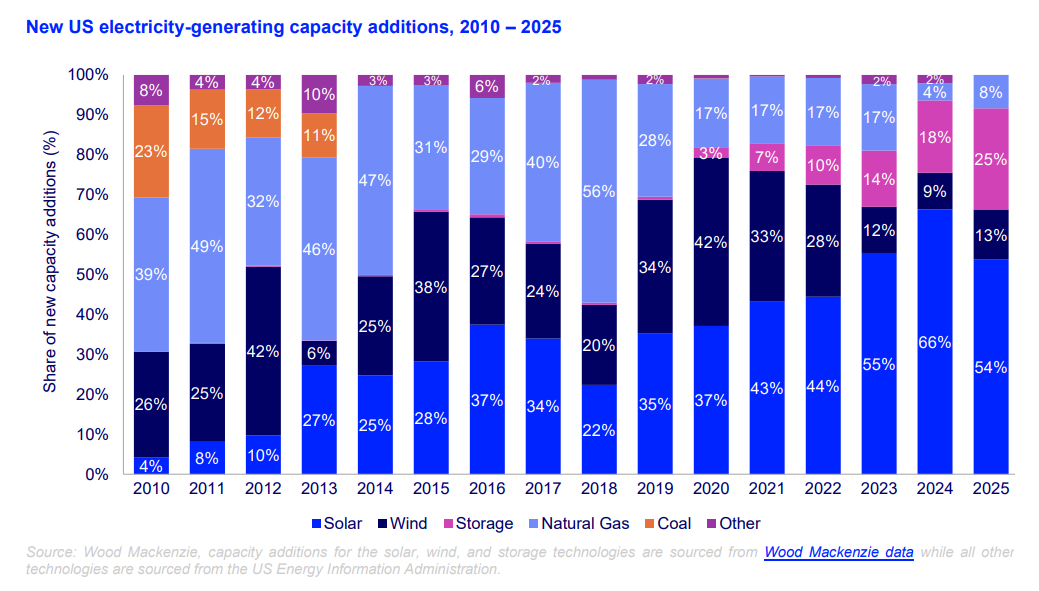
The U.S. solar industry installed 43.2 gigawatts (GW) of capacity in 2025, according to the Solar Market Insight 2025 Year in Review report released by the Solar Energy Industries Association (SEIA) and Wood Mackenzie.
The additions led to photovoltaic solar accounting for 54% percent of all new U.S. electricity-generating capacity, retaining its position as the number one technology for the fifth year in a row. In total, solar, wind and storage accounted for 92% of all new generation capacity.
While annual solar capacity installations remain high, overall installation volumes were down 14% compared to 2024 levels. The report says this slowdown was driven by a massive drop in utility-scale installations concentrated entirely in Q4, during which installations fell by 40% quarter-over-quarter.
This decline was exacerbated by the passage of the One Big Beautiful Bill Act (OBBBA), which the report says caused developers to reevaluate their project pipelines and push online dates into the 2026–2028 window.
Despite the year’s reduced capacity additions and expectations for moderate growth in installations in the coming decade, SEIA and Wood Mackenzie assert that the U.S. solar industry will retain its leading position.
“It’s clear that solar will continue to be the dominant source of new power capacity in the United States, even as gas generation continues to grow,” said Michelle Davis, head of solar at Wood Mackenzie and lead author of the report. “Strong demand growth combined with escalating costs of new gas plants will allow solar to remain competitive, even without tax credits.”
Market segment performance and pricing
Installations in the utility scale segment decreased by 16% in 2025 compared to the previous year, with 34.7 GW installed. The report reveals that utility-scale pricing increased by 11% for installations using fixed-tilt racking and 14% for single-axis trackers. The increases were largely due to increases in the cost of structural and electrical components, as well as a 35% increase in EPC overhead and margin as the companies sign on to projects scheduled to meet coming safe-harbor and tax credit deadlines.
Residential volumes saw a slight decline and pricing was relatively flat year over year. The report attributes these findings to two major factors: Companies didn’t have enough time to react to the OBBBA changes that killed the Section 25D tax credits at the end of the year, and solar equipment shortages and delivery delays hampered the final installation numbers despite a surge in sales and permitting activity.
Commercial solar pricing increased by 10% and installations grew 6% year-over-year as California’s pipeline of legacy net metering projects (NEM 2.0) continued to come online in 2025.
Community solar capacity installations declined by 25% compared to 2024 as installation rates in Maine and New York slowed and no new programs drove growth.
Long-term outlook and forecast scenarios
Looking ahead, Wood Mackenzie forecasts a prolonged period of relatively stable installation volumes through at least 2036. While volumes are expected to rebound to slightly above 43 GW in 2026, the report projects the industry will not exceed that volume again until 2033.
The forecast includes high and low case scenarios that consider the potential effects of clarity (or lack thereof) in guidance around Foreign Entities of Concern (FEOC), safe-harboring strategies, trade tariffs, and permitting reform.
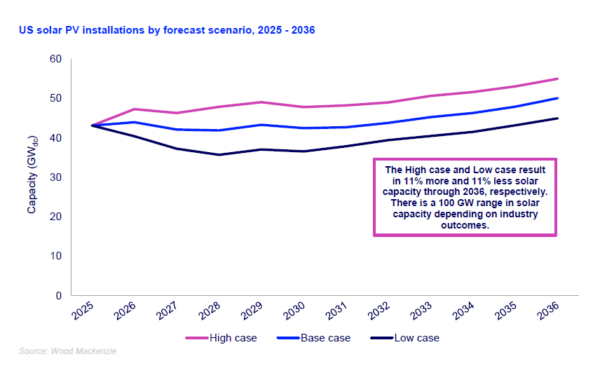
Image - Wood Mackenzie
The estimates account for the potential effects of shifting policy and economic factors, which the authors say could swing U.S. solar installations by 11% above or below the base case over the next 10 years, rising as much as 56 GW in the high scenario or falling by 55 GW in the low scenario.
The report notes that distributed solar segments are particularly sensitive to these cost and policy shifts, showing a 23% to 28% variance between the high- and low-case scenarios over the next decade. Utility-scale solar forecasts vary by only 6% to 7% due to the greater “inertia” of large project pipelines, equipment supply chains, and existing interconnection constraints.
Geographic and political trends
At the state level, Texas again led the nation in installation volume, adding around 11 GW of new solar capacity in 2025, which roughly matched the state’s total from the two years prior.
California came in second with 4.7 GW of capacity additions, while Indiana jumped from its 10th-place showing in 2024 to reach the third spot in the nation for 2025, with 3 GW installed.
In total, 11 states set new annual installation records in 2025, and 12 states added over 1 GW of new solar capacity. The report found that over two-thirds of all solar capacity installed in 2025 was built in states won by President Trump.
In total, 11 states set new annual installation records, and 12 states added more than 1 GW of new capacity. Top states for deployment included Texas, Indiana, Florida, Arizona, Ohio, Utah, and Arkansas.
Domestic manufacturing milestones
The report called 2025 “a monumental year for the U.S. solar manufacturing industry,” specifically pointing to a 50% jump in module manufacturing, along with significant expansion of cell capacity and the first wafer capacity in the country since 2016.
With the new wafer capacity fed by domestically-sourced polysilicon, the United States now has the capacity to produce every major component of the solar supply chain.
Despite these positive developments, the report notes that the actual output of these facilities remains considerably below domestic demand, and the report notes that “critical uncertainties” in the guidance around restrictions on FEOC influence remain, leading to continued uncertainty in the market.
The full version of the U.S. Solar Market Insight report is available for purchase from Wood Mackenzie.
This content is protected by copyright and may not be reused. If you want to cooperate with us and would like to reuse some of our content, please contact: editors@pv-magazine.com.


By submitting this form you agree to pv magazine using your data for the purposes of publishing your comment.
Your personal data will only be disclosed or otherwise transmitted to third parties for the purposes of spam filtering or if this is necessary for technical maintenance of the website. Any other transfer to third parties will not take place unless this is justified on the basis of applicable data protection regulations or if pv magazine is legally obliged to do so.
You may revoke this consent at any time with effect for the future, in which case your personal data will be deleted immediately. Otherwise, your data will be deleted if pv magazine has processed your request or the purpose of data storage is fulfilled.
Further information on data privacy can be found in our Data Protection Policy.