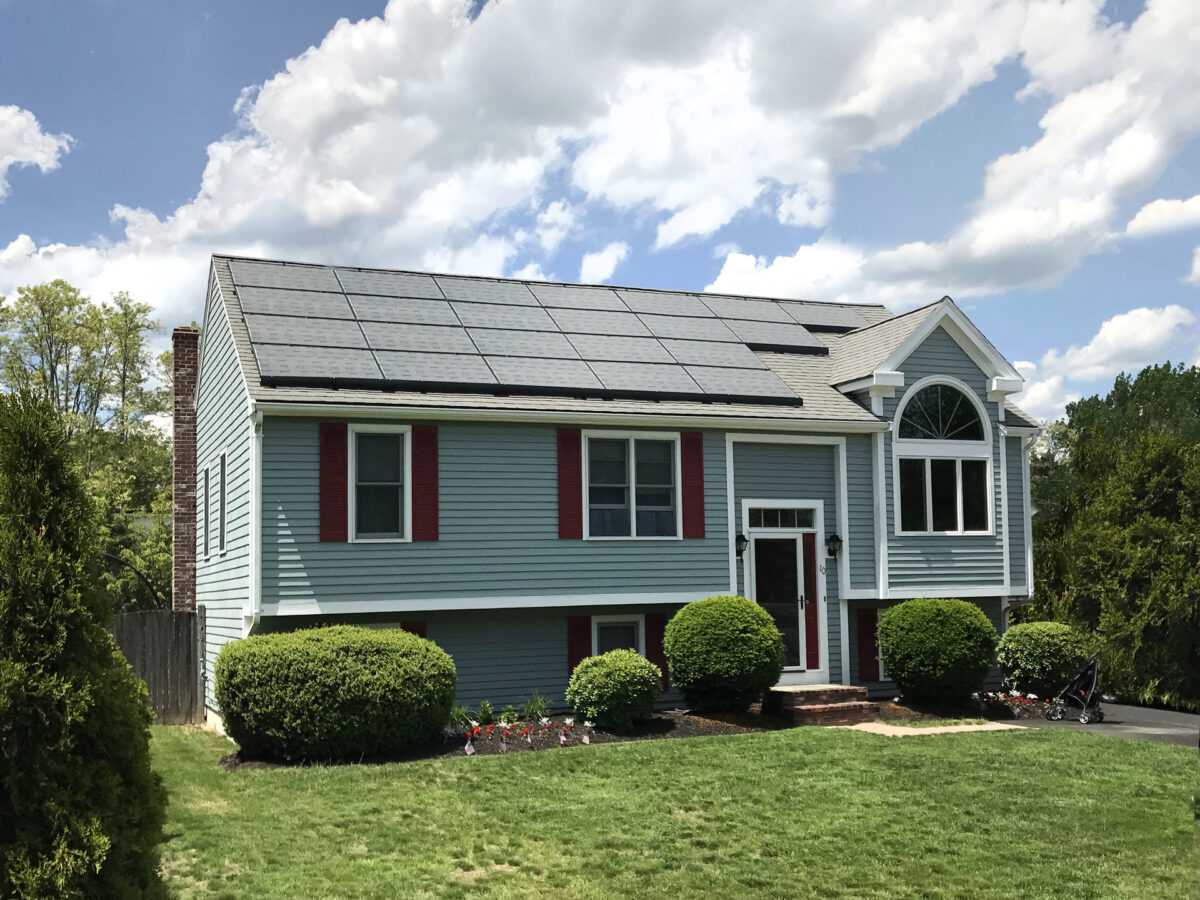
The duck curve arrived in New England in 2018, and this Easter weekend, behind-the-meter (BTM) solar was the primary driver of record-low electricity demand on the ISO New England (ISO-NE) power grid. This outcome wasn’t unexpected, as similar patterns have emerged during past spring holidays.
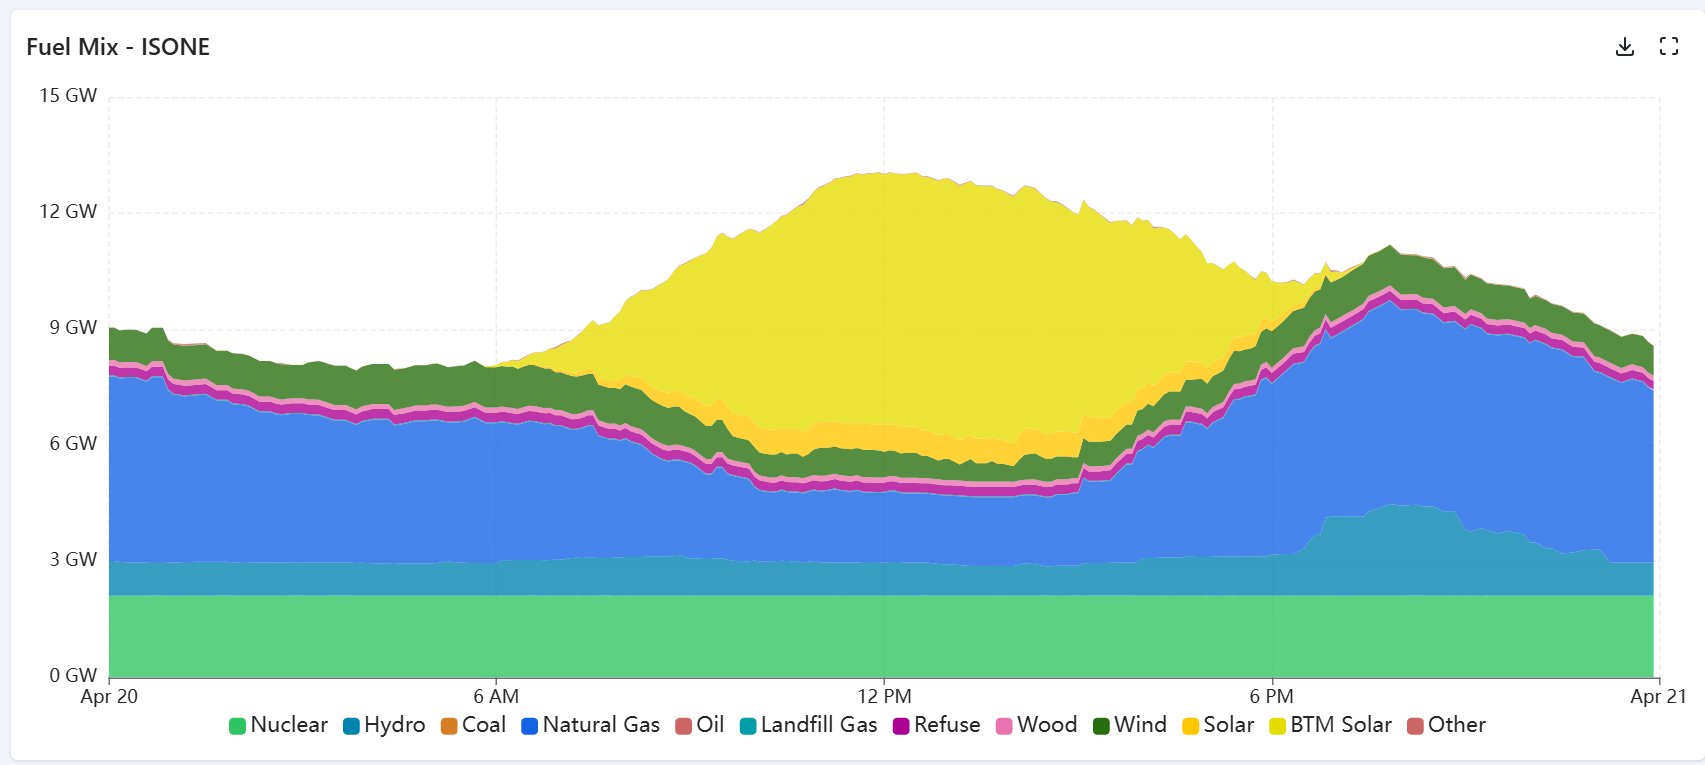
Image — Source: ISO-NE
According to GridStatus.io, Sunday marked the second-highest BTM solar peak output in ISO-NE history, reaching 6.59 GW at 12:05 p.m. The all-time record was set just three days earlier, with 6.619 GW.
At 12:05 p.m., when BTM solar peaked, electricity drawn from utility-scale power plants was nearing its daytime low at 5.9 GW. At that moment, BTM solar alone (as seen in the chart above) was supplying approximately 54% of total electricity demand, which stood at 12.1 GW.
By 1:55 p.m., as both electricity demand and solar output eased, the region hit a new record-low net demand of 5.22 GW.
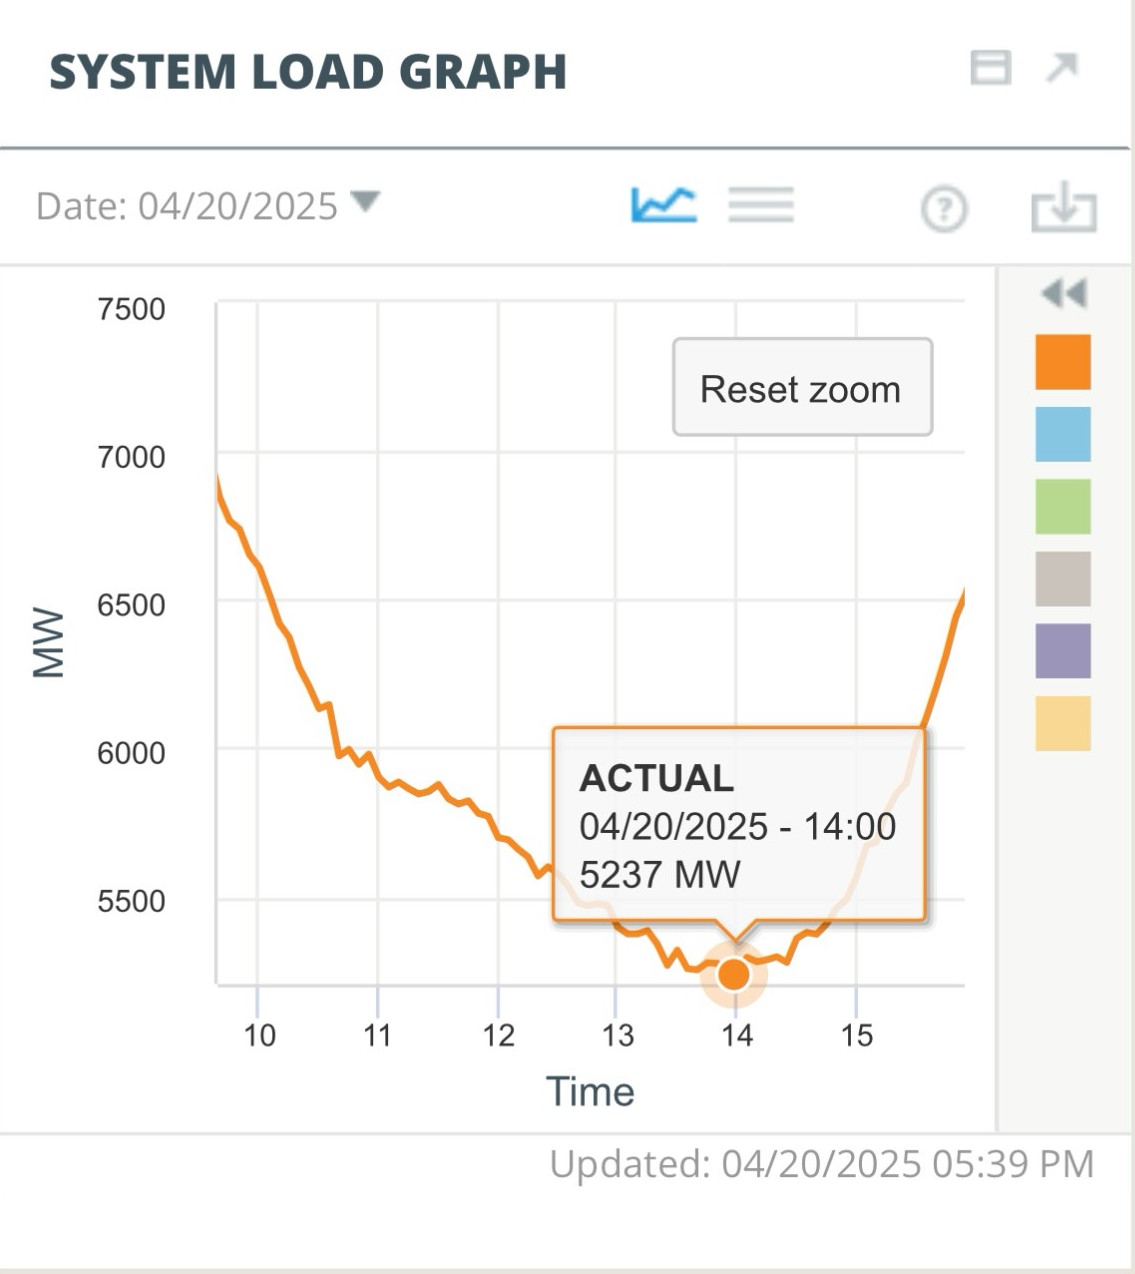
Image — Source: ISO-NE
At that moment, utility-scale solar was generating approximately 0.6 GW, while wind output hovered near its daily low at 400 MW. Nuclear power held steady at about 2.1 GW, and natural gas generation dropped to 1.7 GW, making it the second-largest source of power at that point.
The 5.22 GW net demand represents a 20% decline from the previous record low of 6.5 GW set the year before.
One notable effect of low demand and increasing solar generation was that, during the midday window, New England began exporting electricity to New York State. ISO-NE energy charts show that the Roseton 345 kV transmission line crossed into net export territory, delivering up to 368 MW to New York. This reversed the overnight pattern, when ISO-NE imported as much as 1.6 GW through the same line.
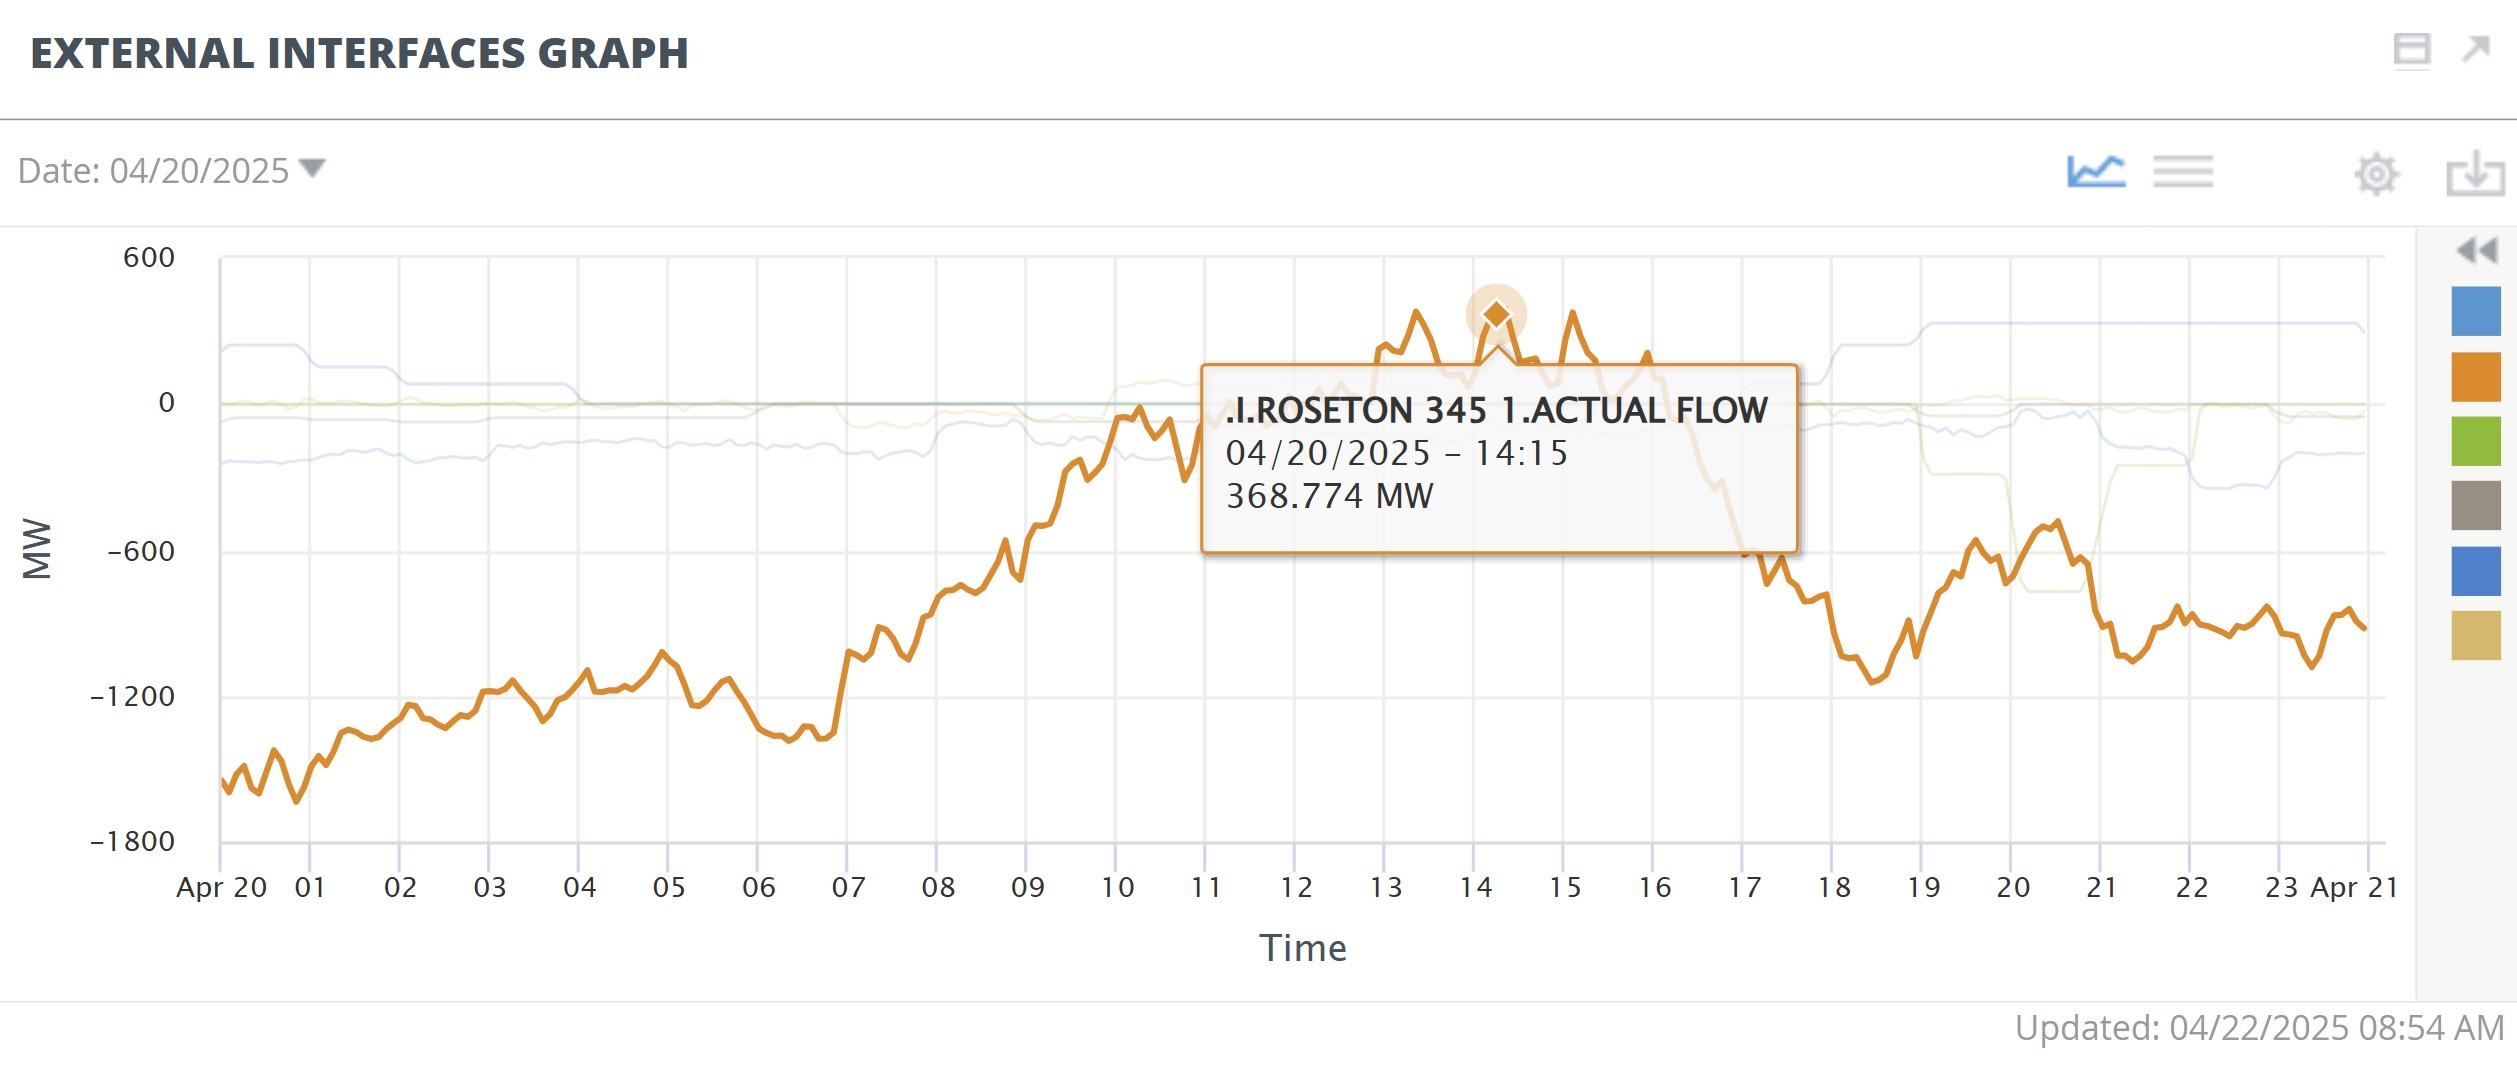
Image — Source: ISO-NE
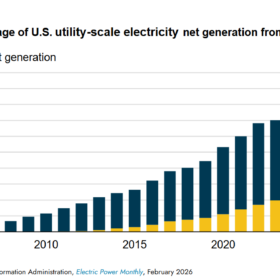
New England’s BTM solar capacity is unique in the United States. According to an analysis by the Energy Markets & Policy team at Berkeley Lab, as of the end of 2023, New England is the only region where more electricity is generated from solar power systems smaller than one megawatt than from larger installations. Massachusetts leads the nation, with nearly 16% of its in-state electricity generation coming from small-scale solar, followed by Hawaii at 13%, California at 11.5%, Vermont at 10.3%, Rhode Island at 6.7%, and Maine at 5.1%.
This content is protected by copyright and may not be reused. If you want to cooperate with us and would like to reuse some of our content, please contact: editors@pv-magazine.com.


By submitting this form you agree to pv magazine using your data for the purposes of publishing your comment.
Your personal data will only be disclosed or otherwise transmitted to third parties for the purposes of spam filtering or if this is necessary for technical maintenance of the website. Any other transfer to third parties will not take place unless this is justified on the basis of applicable data protection regulations or if pv magazine is legally obliged to do so.
You may revoke this consent at any time with effect for the future, in which case your personal data will be deleted immediately. Otherwise, your data will be deleted if pv magazine has processed your request or the purpose of data storage is fulfilled.
Further information on data privacy can be found in our Data Protection Policy.