California’s recent strides in emission-free electricity and energy storage have garnered global attention, from top-tier publications to outlets on the other side of the globe.
According to data from the California Independent System Operator (CAISO) and record keeping by Stanford Professor Marc Jacobson, “for 45 days straight and 69 of 75, California #WindWaterSolar (electricity) supply has exceeded demand part of each day. On May 20, (supply exceeded demand for) 7.58 h, peaking at 135.4% of demand. On average over 75 days, WWS>demand for 5.3 h/day.”
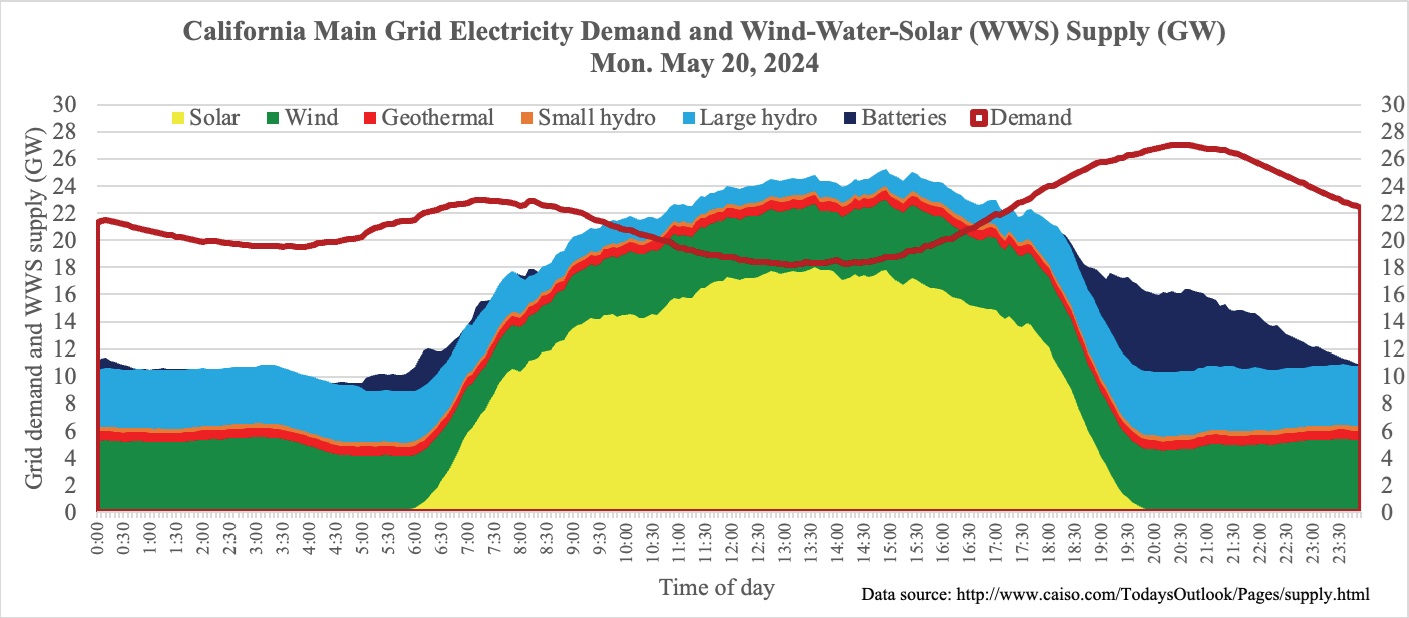
This performance is bolstered by the extensive use of batteries during the evening electricity peak demand period. As seen in the chart above, the batteries (seen in dark blue) play a crucial role during these ramping periods.
Essentially, the engineers managing California’s power grid have adapted to harness inherently unpredictable power sources.
When it comes to solar, these impressive figures still underestimate the impact of sunlight. This is because they only account for utility-scale generation, with rooftop and behind-the-meter projects contributing an additional 15 GW of capacity worth of electricity – almost equal to utility scale capacity.
For utility-scale supplied solar power, April in CAISO showcased an impressive performance. Generally, April is the third-highest month for solar as a percentage of all electricity, per data from pv magazine USA’s 50 States of Solar report.
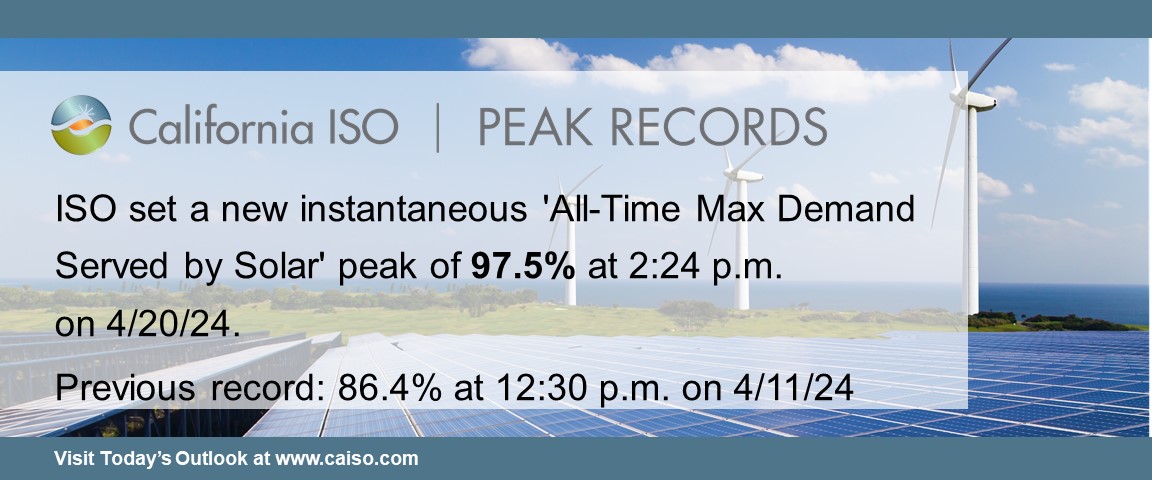
However, this past April, the instantaneous “All-Time Max Demand” record was broken four times, rising from an 80.4% record set in April of 2022, to a new record of 97.5% on April 20th this year.
This raises an interesting question: why did ‘All Time Max Demand Served’ jump so significantly this year, especially after it had remained mostly static throughout 2023? It all boils down to increased battery capacity, which has allowed solar to expand its influence more effectively. Notably, we recently saw utility-scale battery capacity surpass 8 GW, which has now began to offset the evening peak demand periods.
Since the electricity for these batteries primarily comes from solar power, perhaps we should also consider that solar is meeting the evening peak demand?
pv magazine USA conducted an analysis of CAISO generation data and discovered that on April 21, solar electricity actually peaked at more than 123% of total electricity generation.
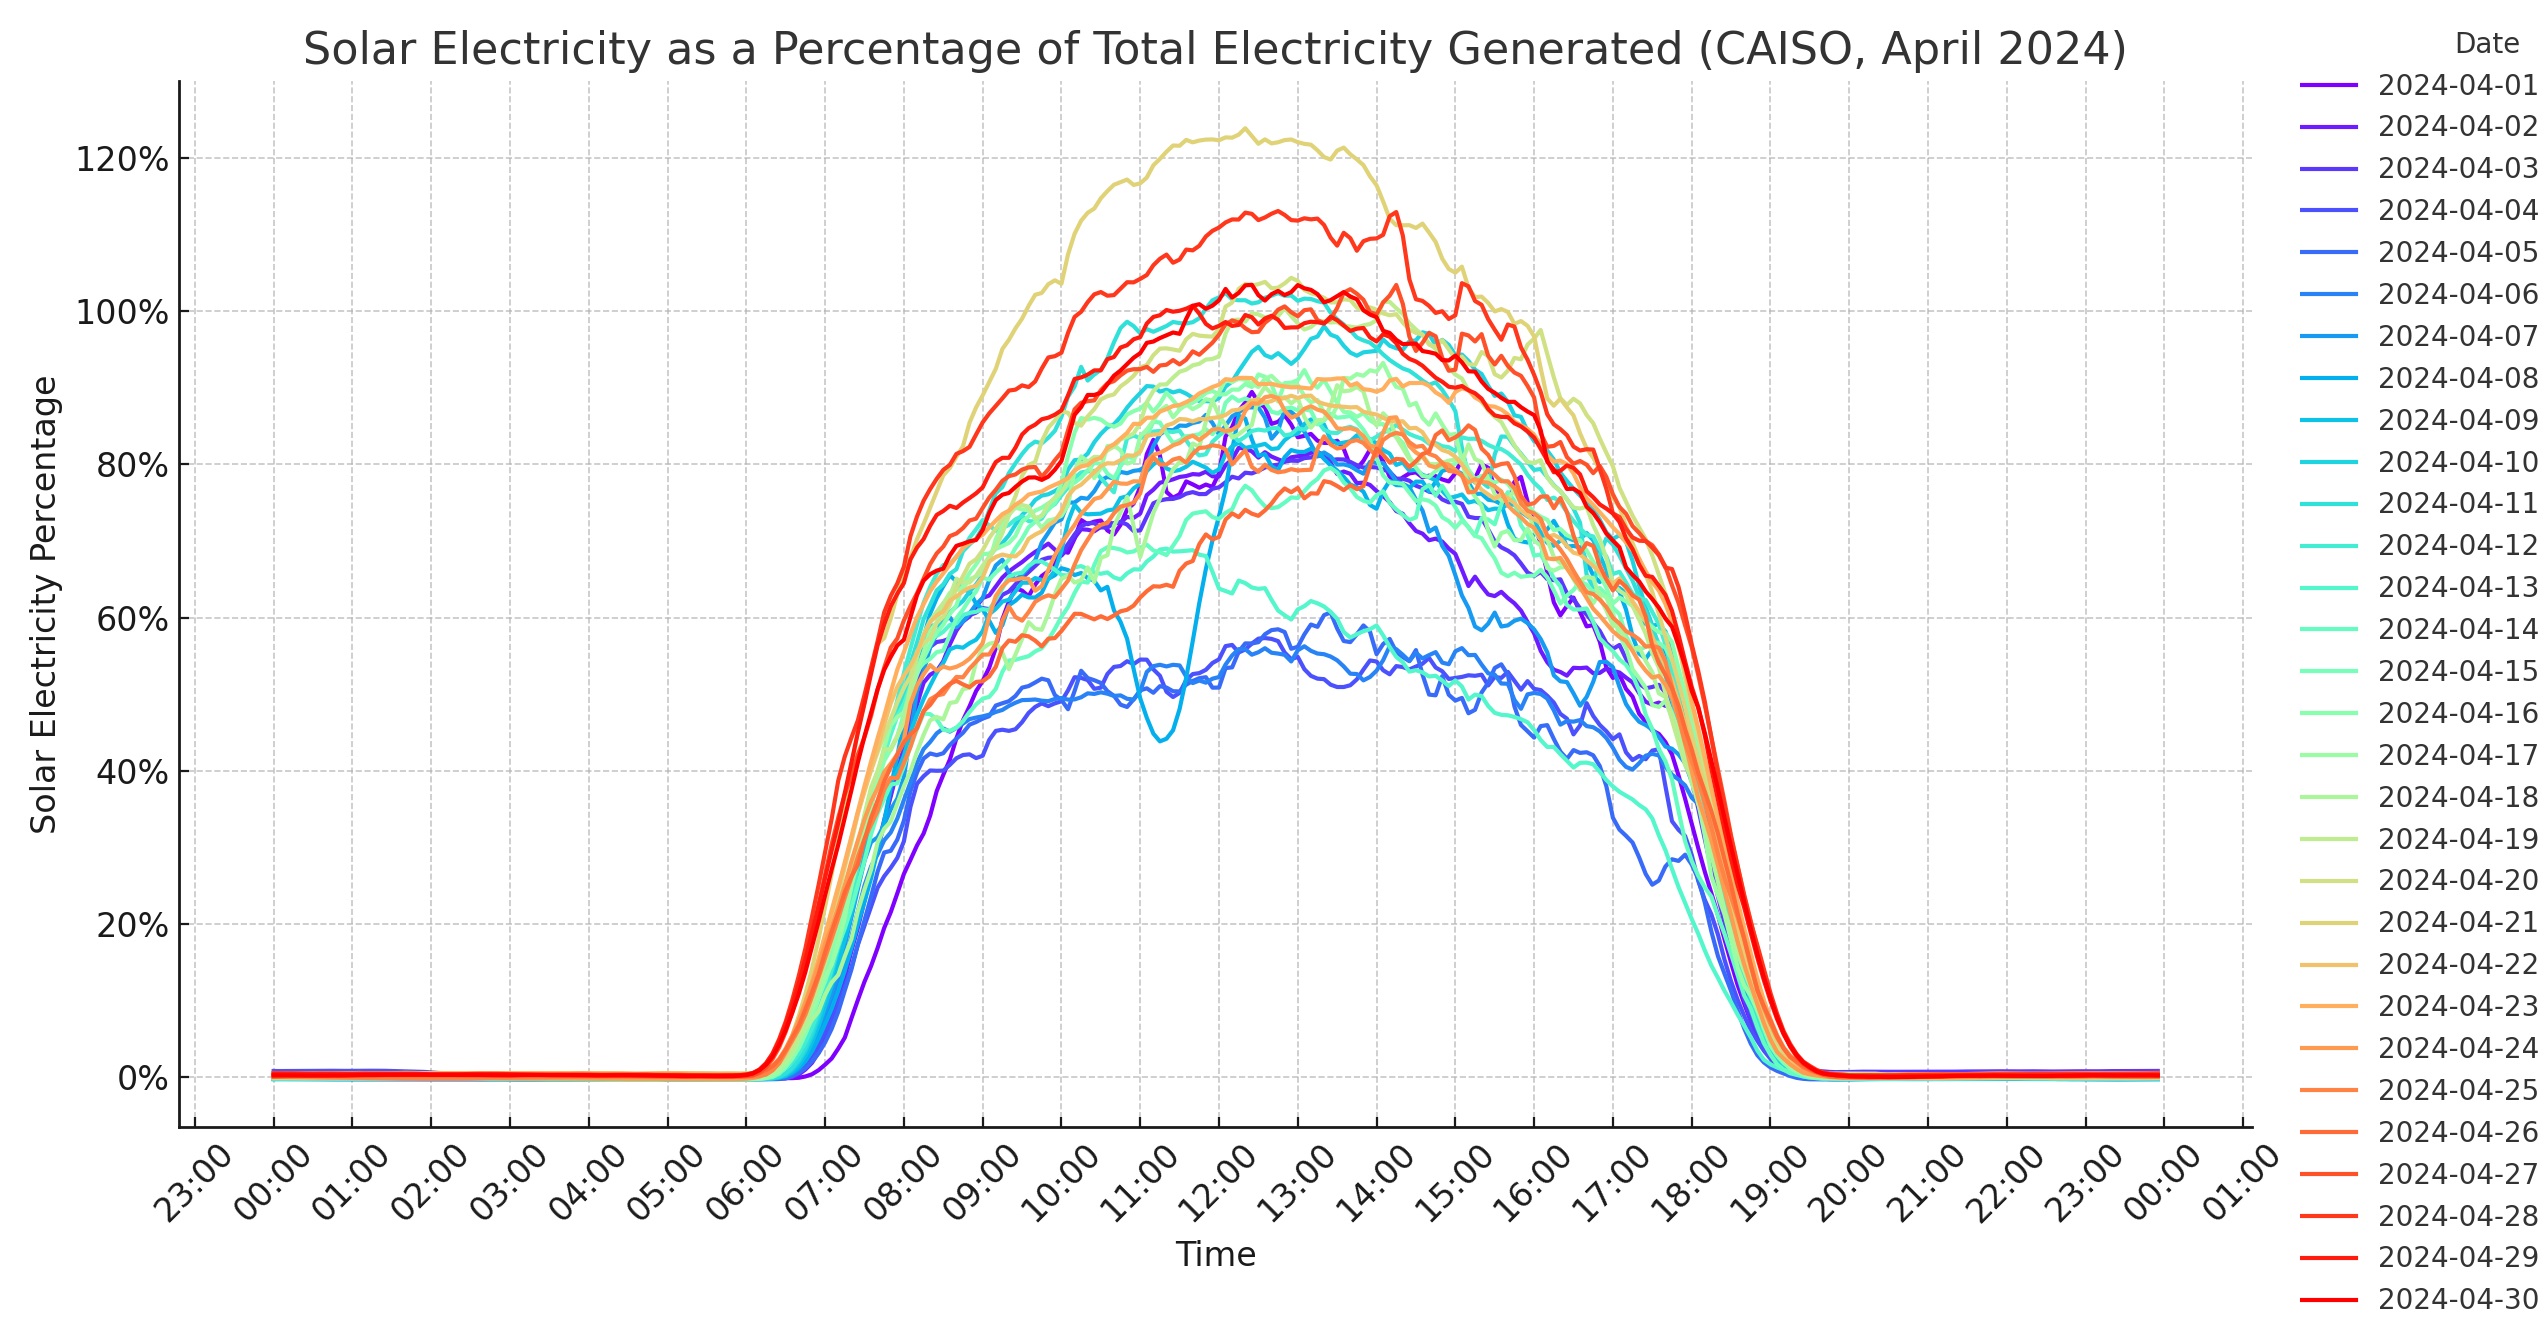
Solar can supply more than 100% of demand due to the net effect of batteries charging. On this date, solar also accounted for almost 38% of all electricity generated within the CAISO region, marking the peak value for the month. Additionally, the following day, CAISO recorded a new high for peak solar output at 18,374 MW.
The chart also highlights the April 8th eclipse – noted with a large dip in generation in light blue around 11 a.m. PST.
According to gridstatus.io, April 21st also marked a new record for battery output at 10:10 p.m., reaching 6,458 MW. This record has since been surpassed multiple times, with the current peak now at 7,528 MW. This record is expected to continue to grow as more utility-scale energy storage is deployed this year.
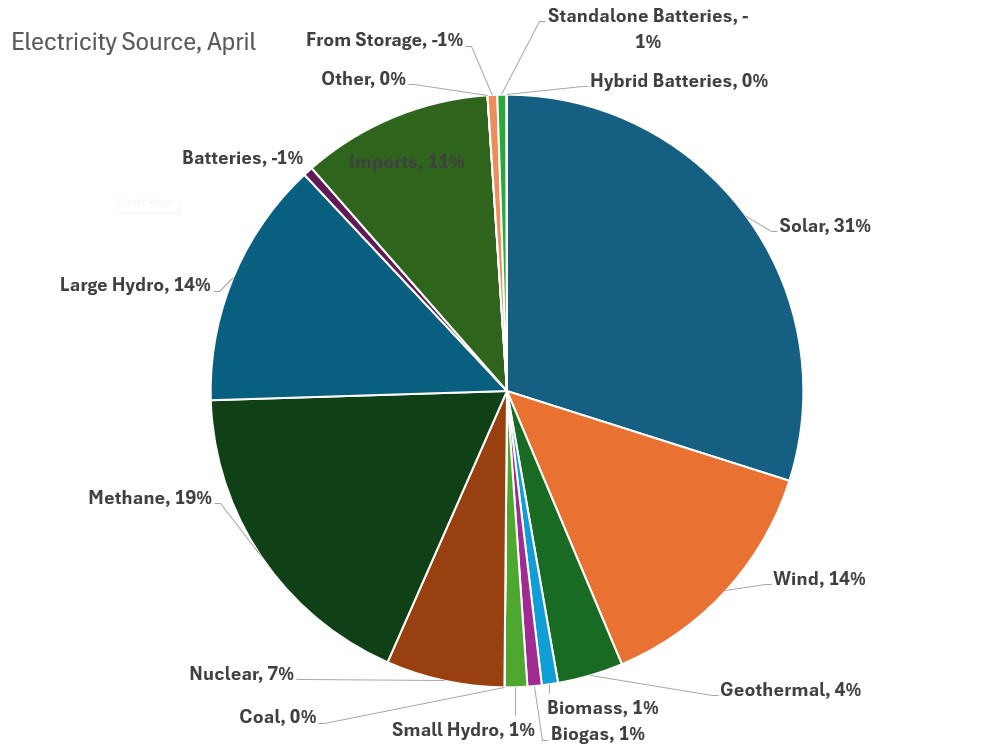
Over the entire month of April, solar was the largest source of electricity by far, contributing just over 31%. In total, solar combined with hydro, wind, nuclear, and geothermal provided almost 70% of the electricity, with methane generating 19%. Given that imports historically are historically 50% emission-free, this would put the total emission-free electricity used in California in April at approximately 75%.
This content is protected by copyright and may not be reused. If you want to cooperate with us and would like to reuse some of our content, please contact: editors@pv-magazine.com.


Great article John. It’s been a fine morning for learning. Thanks.