The global solar market continues to grow, as an estimated 413 GW was installed in 2023, rising 58% year-over-year, according to Bloomberg NEF. Along with this growth comes a rising trend in system underperformance, said a report from Raptor Maps.
Raptor Maps analyzed data collected from drones, robotics, application program interfaces (API) and internet of things (IoT) sensors. The company operates an AI-driven “drone in a box” that it deploys at solar facilities. Its dataset comprises 125 GW of PV assets, spanning 41 countries.
Among the analyzed assets, the company found $177.7 million in preventable annualized revenue losses. Extrapolated to solar assets worldwide, this would equate to $4.6 billion in potential annual revenue losses.
The report found average losses of $4,696 per MW, though losses varied regionally. Since 2019, the average losses from underperformance have increased from a 1.61% average power loss, to 4.47% in 2023. Raptor Maps said this equates to an internal rate of return at loss of at least 190 basis points in a 100 MW solar asset.
One factor in increased average power losses is the increase in average system size. Raptor Maps said larger projects tend to have a higher loss percentage. The Solar Energy Industries Association (SEIA) reports that average solar project sizes have grown from 13.9 MW in 2019 to 59.6 MW in 2023, contributing to increased average losses.
Furthermore, inefficiencies in operations and maintenance are causing potential revenue losses, said the report. In a 2023 survey, the company found “many operators identified preventative maintenance visual inspections as a significant source of time wastage, and a large number of respondents also identified validating nuisance alarms as another way time is wasted.”
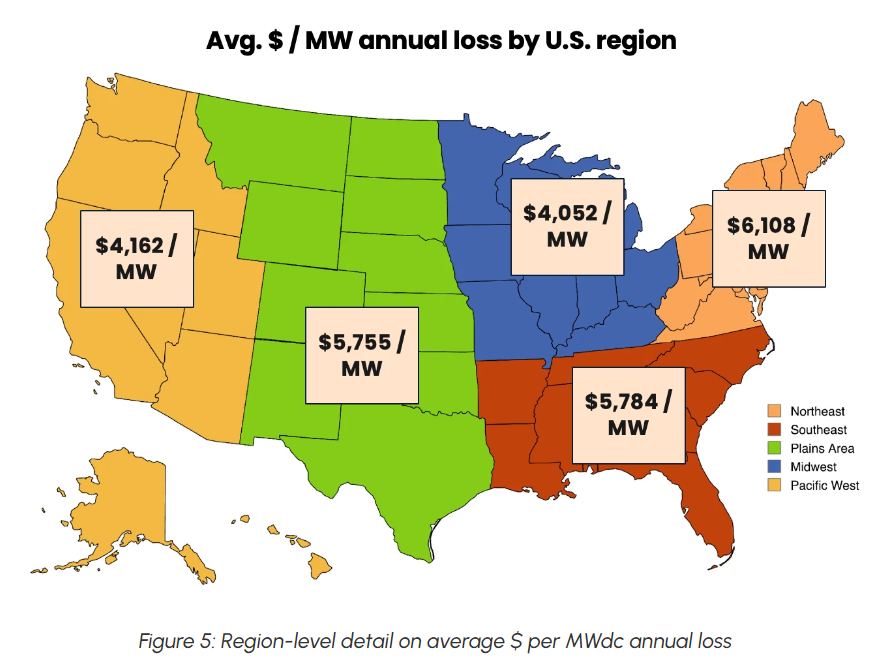
Regionally, preventable losses vary widely. In the Midwest, average annual losses were modeled at $4,052 per MW, while in the Northeast, losses exceeded $6,108 per MW. The report noted that asset underperformance losses are lower in the U.S. than the global average.
What causes underperformance?
Raptor Maps identified several sources of power losses. The largest fault, following an historical trend, was at the system level. Inverter faults, string outages, and combiner faults contributed power losses of 1.91%, 0.90%, and 0.81% respectively. Instances of tracker issues have also risen from 0.26% in 2022 to 0.46% in 2023.
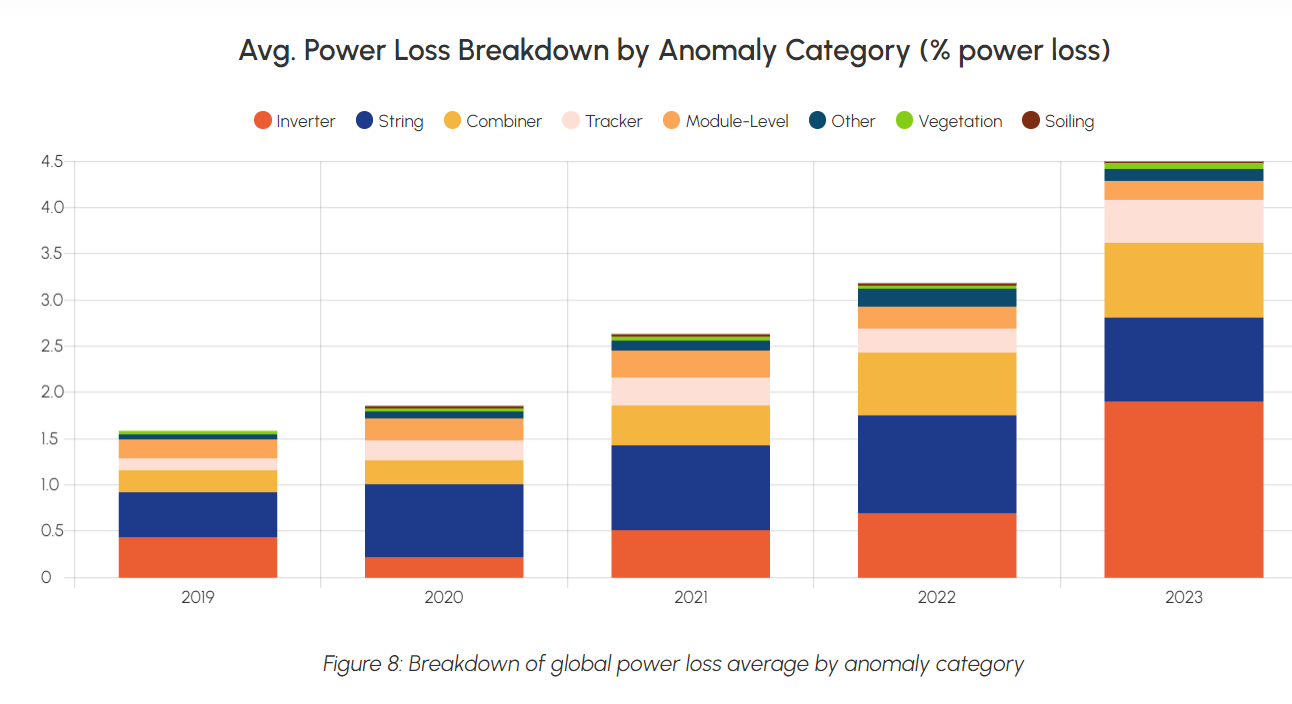
Raptor Maps noted that module performance has improved slightly, with losses decreasing by about 12% year-over-year. However, with extreme weather events on the rise, median annual power losses attributed to weather events is about 1%. In certain extreme events, weather related losses can lead to losses of up to 60%, said Raptor Maps. Hail events, particularly in booming solar markets like Texas, are a significant risk for solar asset operations.
Risk profiles vary by module type, said Raptor Maps. Thin-film modules averaged lower power losses from defects and manufacturing anomalies than polycrystalline and monocrystalline. However, thin-film modules were twice as likely to have physical damage as polycrystalline modules, and three-and-a-half times more likely to sustain physical damage than monocrystalline modules.
Find the Raptor Maps 2023 report here.
This content is protected by copyright and may not be reused. If you want to cooperate with us and would like to reuse some of our content, please contact: editors@pv-magazine.com.


By submitting this form you agree to pv magazine using your data for the purposes of publishing your comment.
Your personal data will only be disclosed or otherwise transmitted to third parties for the purposes of spam filtering or if this is necessary for technical maintenance of the website. Any other transfer to third parties will not take place unless this is justified on the basis of applicable data protection regulations or if pv magazine is legally obliged to do so.
You may revoke this consent at any time with effect for the future, in which case your personal data will be deleted immediately. Otherwise, your data will be deleted if pv magazine has processed your request or the purpose of data storage is fulfilled.
Further information on data privacy can be found in our Data Protection Policy.