For the solar industry in the United States, 2022 was a year of contrasting events. On one hand, the euphoria of the Biden administration’s Inflation Reduction Act (IRA) overwhelmed all other industry dynamics, and is set to bolster the sector for decades. On the other hand, the total amount of solar power deployed in 2022 actually decreased compared to previous years.
The International Energy Agency (IEA) has released its National Survey Report of PV Power Applications in the United States of America (PVPS), providing a comprehensive overview of 2022.
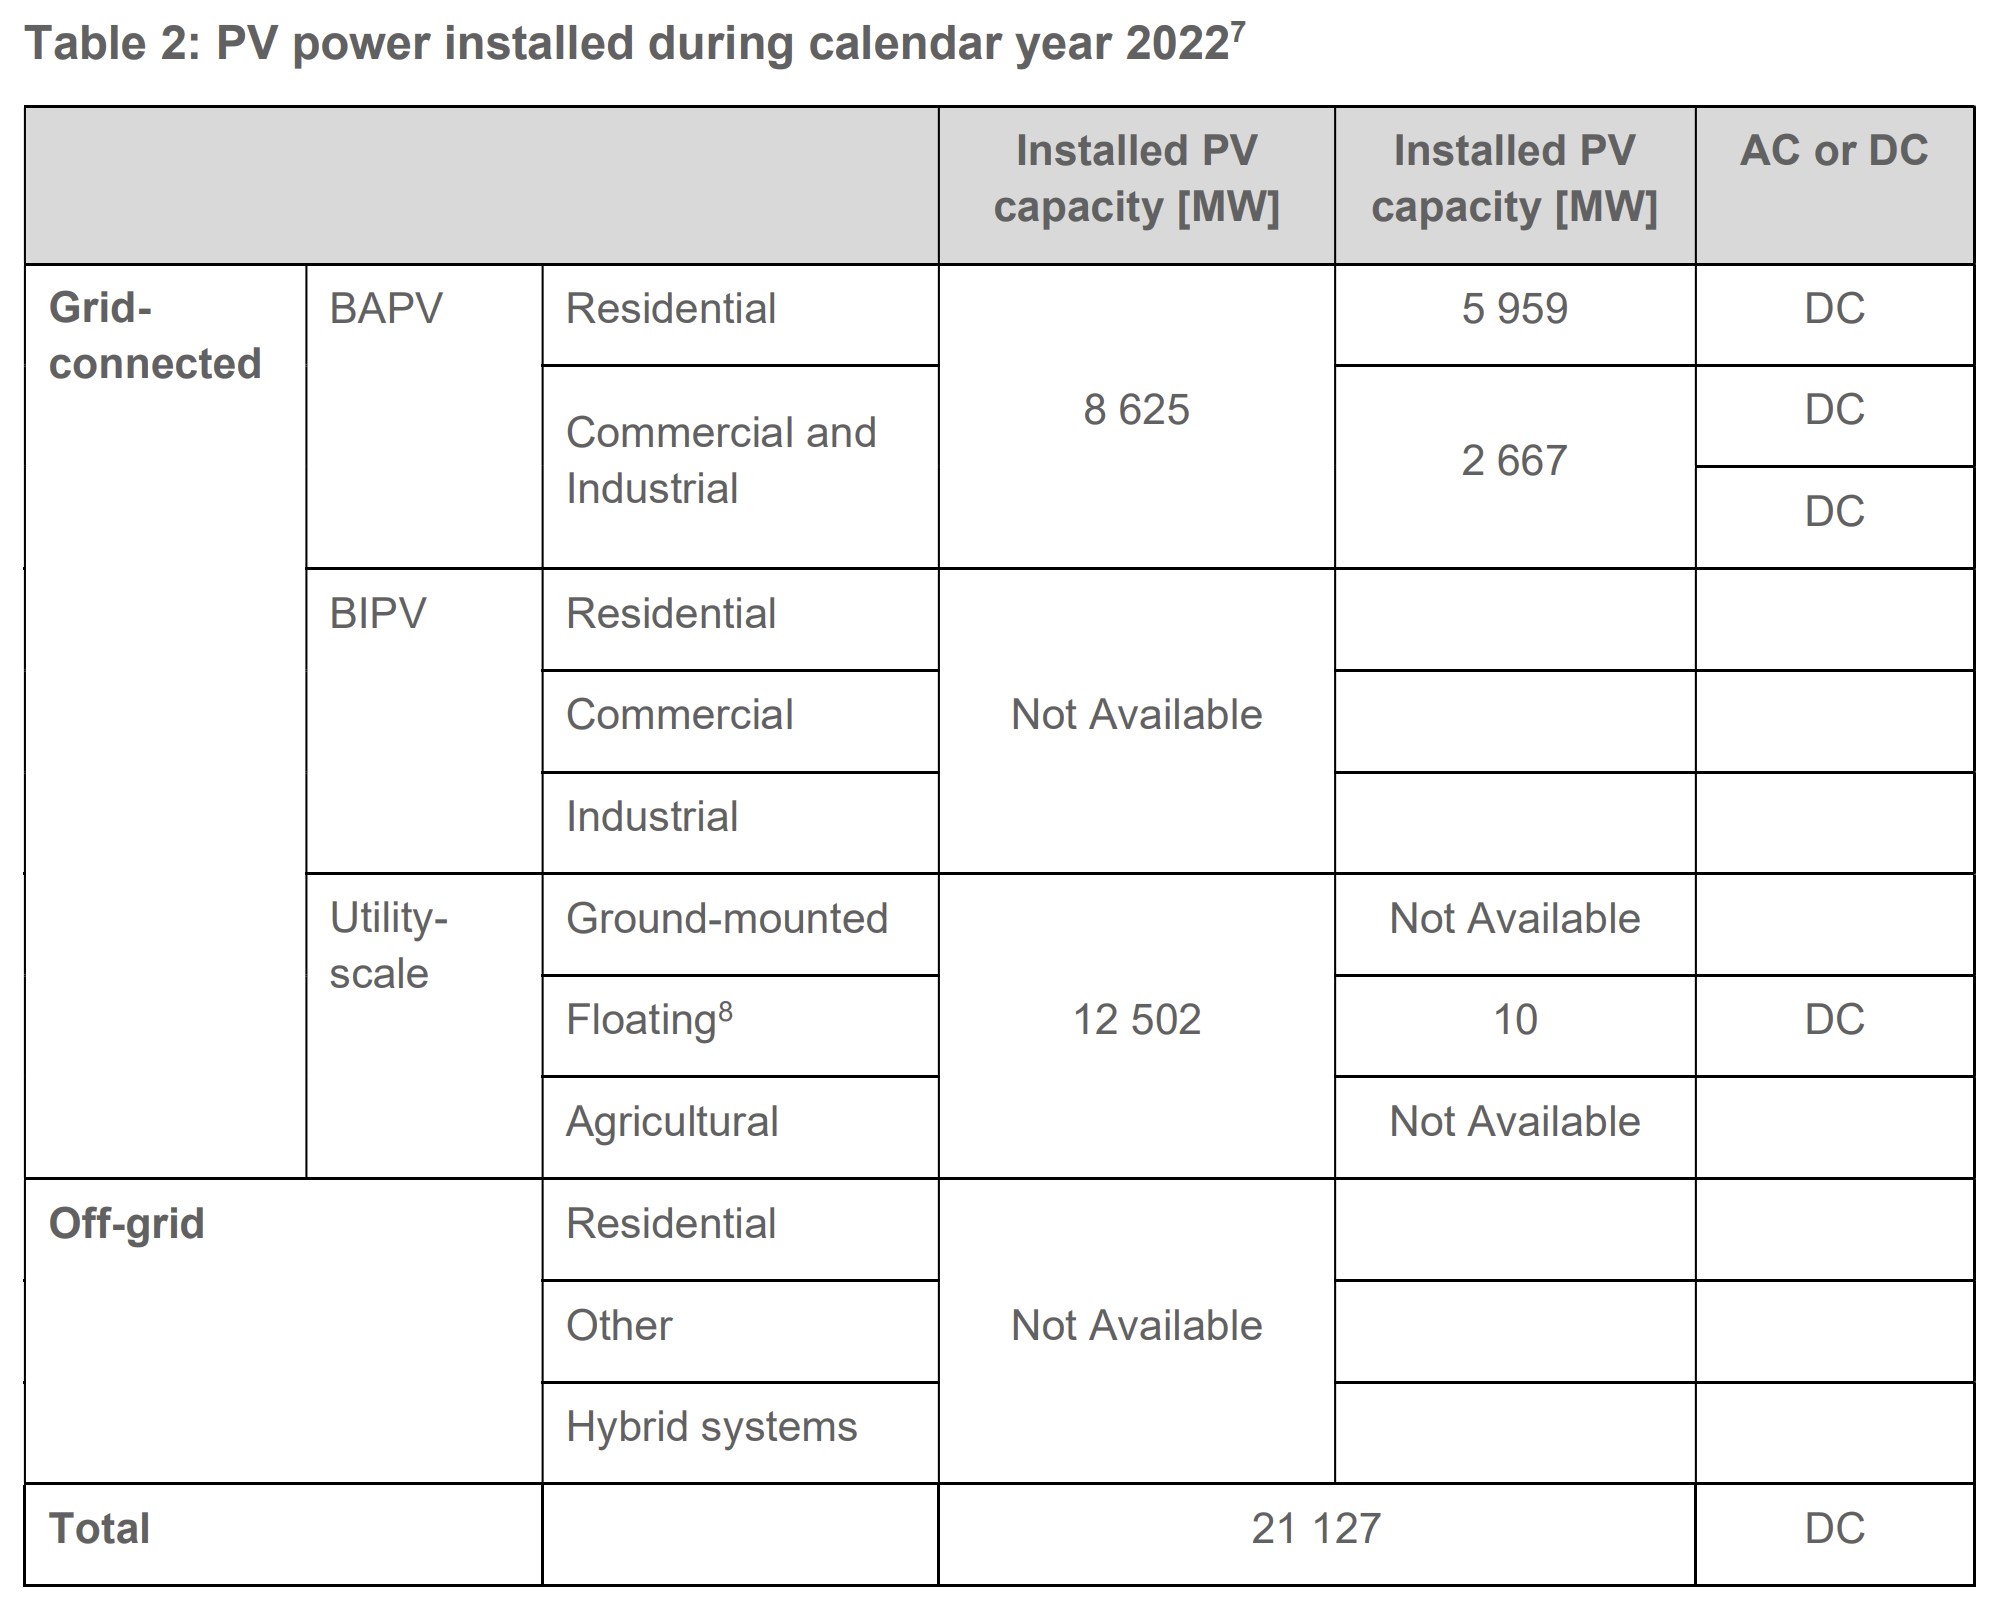
According to a joint analysis by Wood Mackenzie and the Solar Energy Industries Association, approximately 21,127 MWdc of solar power was installed at utility-scale and distributed sites in 2022. This total included 5,959 MW of residential and 2,667 MW of commercial capacity. Cumulatively, 2022 brought the distributed volume to 51,627 MW and utility scale to 89,929 MW, for a total of 141,556 MW of installed solar generation capacity. However, there was no available data on off-grid solar installation volumes.
By the end of 2022, cumulative solar installations had reached 4,043,034 systems, including 3.9 million residential, more than 130,000 industrial, and nearly 4,000 utility-scale systems.
Despite these numbers, the year’s total installed capacity was disappointing. The report attributes this to several factors, noting that “module costs rose during 2022 because of inflation, trade uncertainty (including an investigation into circumvention of antidumping/countervailing duties and scrutiny of the supply chain to ensure compliance with forced-labor laws), high polysilicon costs, and state-level and national policy uncertainties.” These challenges were compounded by inflation, pandemic-related supply chain disruptions, and increased logistics and labor costs.
Nationally, system pricing saw a year-over-year increase in all market segments: residential up 7%, commercial up 2%, small centralized (fixed tilt) up 8%, and small centralized (one-axis) up 3%.
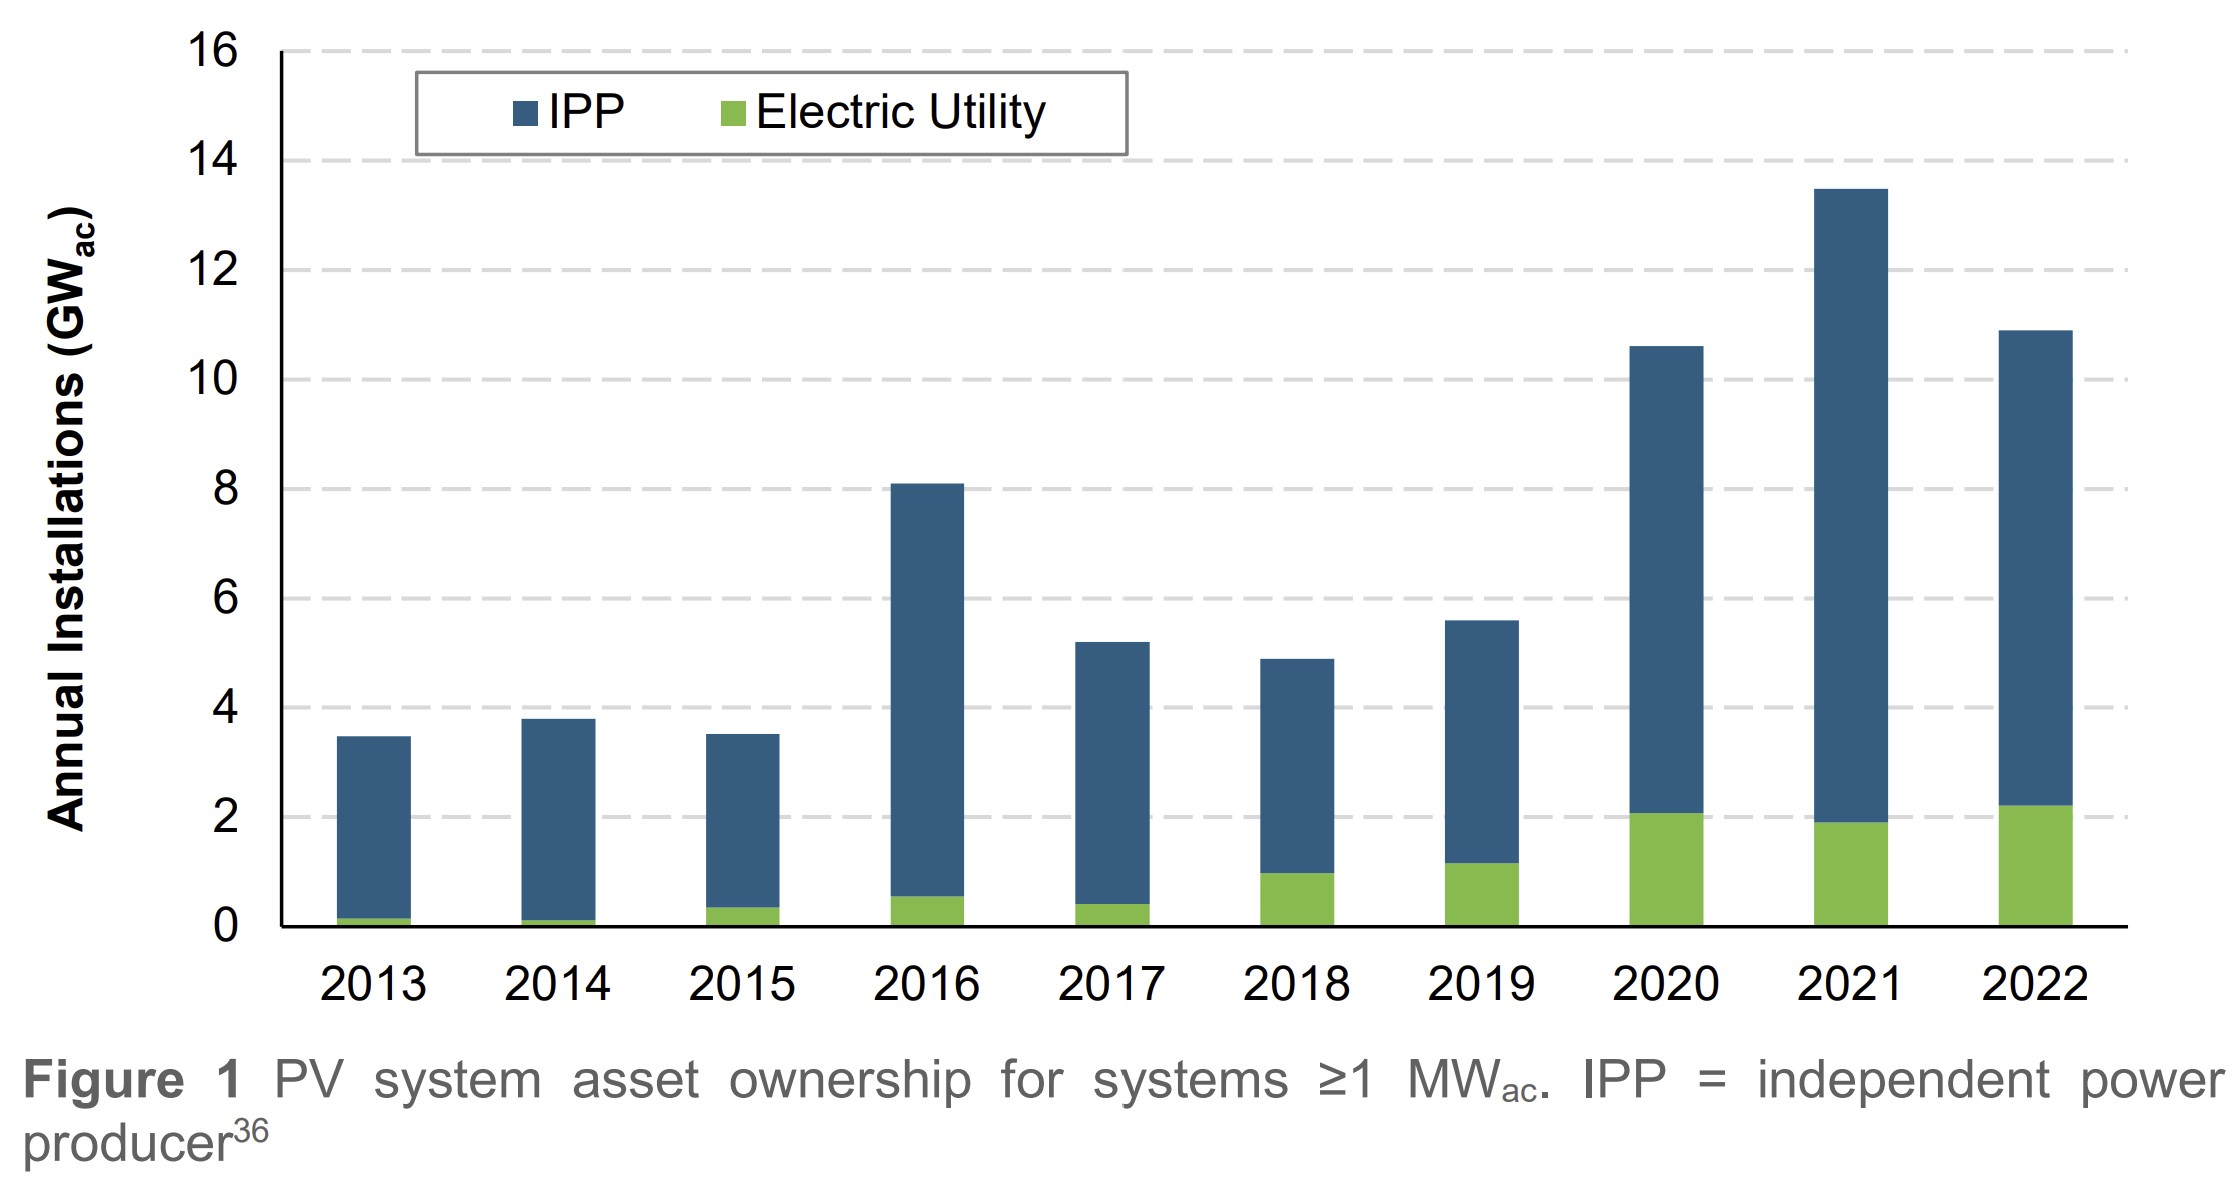
The report highlights that roughly 80% of utility-scale projects in 2022 were owned by third-party power plant operators, bringing the cumulative total to 86%. However, in states like Florida and Virginia, where regulations require utilities to own the assets, the ownership percentages are reversed.
Loans financed 70% of residential installations, while cash purchases accounted for 10%. The remaining 20% were under third-party ownership, involving companies like Sunrun and Sunnova.
The report also discusses various policy frameworks supporting solar power across the U.S., including feed-in tariffs, feed-in tariff premiums (above market price), capital subsidies, green certificates, renewable portfolio standards, income tax credits, net metering, net billing, collective self consumption, interconnection laws, PURPA, financing support, sustainable building requirements, and merchant facilitation measures.
Naturally, the most impactful support came from the implementation of the IRA. The report examines the IRA’s various incentives, such as the Manufacturing Production Tax Credit, 48C, Production Tax Credit, Investment Tax Credit, and others.
The report estimates the “business value” of the solar industry in the United States at $38.6 billion. This figure is derived from the average price of $3.06 per watt for the 8.6 GW of grid-connected distributed solar, amounting to $26.4 billion, and $0.97 per watt for the 12.5 GW of utility-scale capacity deployed, totaling $12.1 billion.
This content is protected by copyright and may not be reused. If you want to cooperate with us and would like to reuse some of our content, please contact: editors@pv-magazine.com.


The 5kw limit on the inverter for domestic installs ,from the grid supplier ,is that standard in the EU , UK . US across domestic install market ? Why ?