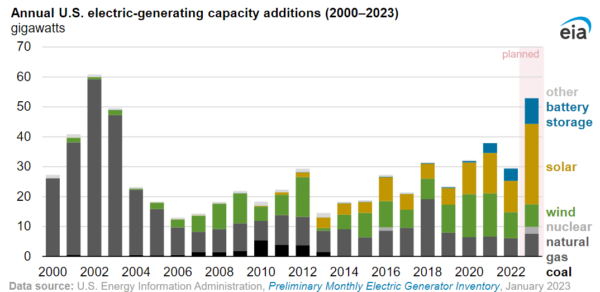
Looking at the profile of energy infrastructure buildout today offers a vision into the future. It is clear that the U.S. energy grid’s future will be dominantly characterized by renewable energy, as the Energy Information Administration (EIA) shared that solar, wind, and battery energy storage technologies are now 82% of new capacity additions actively planned to come online.
Utility-scale solar is still quite young, as substantial capacity additions did not come online until 2010. Wind began its contributions closer to the turn of the millennia. Now, as of January 2023, 73.5 GW of utility-scale solar is online, about 6% of U.S. generating capacity.
Just over half of planned U.S. generation is solar. If all planned projects come online as expected this year, 2023 will mark the most capacity added to the grid for solar yet.
While there have been bumps along the road, the inevitable energy transition, boosted by the emergence of mission-driven investing, has attracted “an unprecedented wave of investment”, said Andrew Redinger, Managing Director and Group Head of Utility, Power & Renewable Energy for KeyBanc Capital Markets, in a white paper.
Bloomberg NEF reports that global investment in renewables totaled $226 billion in the first half of 2022, an increase of 11% year-over-year from 1H 2021. In the last 24 months, the KeyBanc director said renewable energy in the institutional investment world has gone “from niche to mainstream.”
Battery energy storage is stepping forward out of its nascence now, as grid planners call for more energy storage to make use of intermittent renewable energy generation. In 2023, developers plan to add 8.6 GW of battery energy storage capacity to the grid, doubling total battery power capacity in the U.S. in one year.
While the capacity numbers are impressive, electricity generation is the end result that matters most. Wind and solar made up about 17% of the country’s utility-scale capacity in 2021 but produced only 12% of U.S. electricity. Capacity factors, or the actual electrical energy output over a given period of time to the theoretical maximum electrical energy, are lower in wind and solar than in other technologies like nuclear, so generation can be a better apples-to-apples comparison of the true contribution of a technology.
In 2022, solar photovoltaics made up 4.7% of U.S. electricity generation, an increase of almost 21% over the 2021 total when solar produced 3.9% of US electricity. Total solar generation was up 25%, breaking through 200,000 GWh for the year.
If it were not for ongoing solar panel import difficulties and general inflation, solar’s contribution to electricity generation might have reached 5% in 2022, said John Fitzgerald Weaver, Commercial Solar Guy.
Solar as a percentage of monthly electricity generation ranged from a low of almost 3% in January, to just over 6% in April. April’s production marked a new monthly record for solar generation in the U.S.
Total generation of solar electricity peaked in July, at 21,708 GWh. Over the course of the year, solar production reached 202,256 GWh, and total U.S. electricity generation reached 4,303,980 GWh. Total US electricity generation increased by 3.5% over the 4,157,467 GWh produced in 2021.
In total, emissions free energy sources such as wind, solar photovoltaic and thermal, nuclear, hydroelectric, and geothermal, accounted for 37.9% of the total electricity generated in the U.S. This value is barely higher than 2020’s 37.7% – but represents a return to growth after 2021 saw a decrease in emission free electricity to 37%.
This content is protected by copyright and may not be reused. If you want to cooperate with us and would like to reuse some of our content, please contact: editors@pv-magazine.com.


By submitting this form you agree to pv magazine using your data for the purposes of publishing your comment.
Your personal data will only be disclosed or otherwise transmitted to third parties for the purposes of spam filtering or if this is necessary for technical maintenance of the website. Any other transfer to third parties will not take place unless this is justified on the basis of applicable data protection regulations or if pv magazine is legally obliged to do so.
You may revoke this consent at any time with effect for the future, in which case your personal data will be deleted immediately. Otherwise, your data will be deleted if pv magazine has processed your request or the purpose of data storage is fulfilled.
Further information on data privacy can be found in our Data Protection Policy.