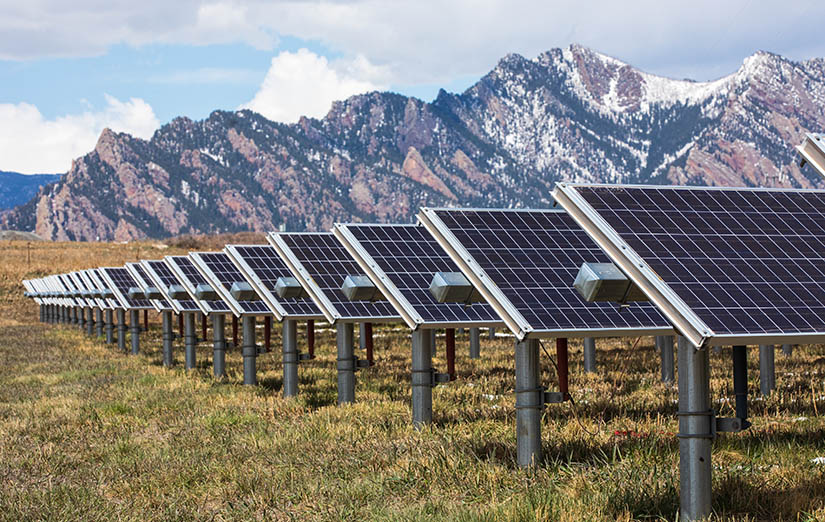
While sunny and cloudless day might seem like the optimal setting for solar cells, too much sun and too much heat can reduce the efficiency of photovoltaics, increasing the levelized cost of energy at larger solar farms, according to new study by the National Renewable Energy Laboratory (NREL), Portland State University and the University of Utah.
As operating temperature rises by 1 degree Celsius, traditional silicon-based solar cells will lose about 0.5% efficiency. In a typical photovoltaic plant, where modules operate nearly 25° Celsius above the ambient temperature, energy losses can reach 12%.
Even for temperate regions like Colorado, ambient temperatures in this range result in module temperatures between 42° and 61 °C over the course of a single day. In hotter locations, possible operating temperatures of up to 70 °C correspond to 12% efficiency losses.
Since more than 50% of PV generation capacity om the U.S. is located in warmer climates of California, Arizona, and Nevada, understanding and finding methods to mitigate panel heating becomes crucial to the success of low-cost solar energy.
This pattern requires cooling measures for solar panels. The study, published in the Journal of Renewable and Sustainable Energy, examines how to exploit the geometry and thus spacing of solar farms to enhance natural cooling.
In the past, cooling methods force wind or water over solar panel surfaces, while others employ materials with less thermal sensitivity to start the cooling process. Such techniques require considerable resources, and in contrast a solar farm with optimally spaced panels facing the correct direction could cool itself through convection using the surrounding wind.
The NREL group improved models that calculate the amount of energy a PV plant produces based on factors such as material, environmental conditions, and panel temperature. They focused on the geometry of solar farms, including the degree of gaps present between the panels.
“Our hypothesis was that the most precise estimate of solar plant convection, and ultimately production efficiency, must consider the farm as a whole and all possible configuration changes,” said author Sarah E. Smith, of Portland State University.
No two solar farms are installed exactly the same way, based on irradiance, shading factors, tilt and height varieties based on latitude and surrounding vegetation.
“The heat-removing wind flow will also move differently throughout each solar plant based on its arrangement, ultimately changing how efficiently heat is removed from module surfaces,” said Smith.
The NREL research group performed wind tunnel experiments and high-resolution simulations with real-world data. Various tweaks including module height, row spacing, angle and wind direction were deployed.
Raising the solar cell’s height and increasing row spacing improved the cell’s power output by 2% to 3%, the group found.
“This correlation between geometry and efficiency is a huge step toward predicting convective cooling for solar farms based on their inherently unique arrangements,” said Smith. “It paves the way for more accurate energy generation and cost prediction models.”
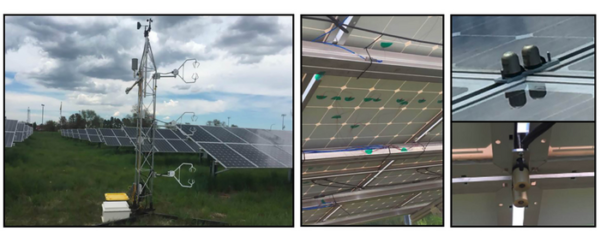
Image: Sarah E. Smith, Portland State University
The study examined 16 PV array designs subjected to a variety of environmental conditions, resulting in a total of 55 unique plant variations. Three methods of data collection were used involving large eddy simulations (LES), wind tunnel experiments (WT), and field data collected at the solar farm of Denver Federal Center (DFC).
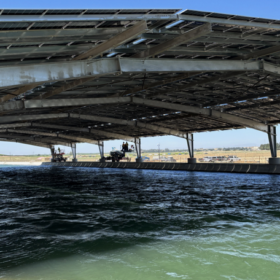
The DFC field site is a 2 MW solar plant located in Denver.
Geometric variations among the three separate campaigns are referenced below. Blue panels represent three of the nine LES configurations, varying row-to-row spacing. The dotted separations denote intermediate spacing configurations omitted from the figure for brevity. Red panels represent geometric variations in the WT arrays, where inclination α was varied for a nominal ground-to-panel case (base height), and panel heights were considered at 30° inclination.
Panels at DFC are shown in purple, and details on the constant configuration of fixed-tilt modules. Gray, dotted panel silhouettes accompanying each diagram represent the most compact array of the LES study to simplify discussion of geometric variations.
Geometrically, a cell’s length scale based on fractal lacunarity, a term for a gap space or a pool, encapsulates all aspects of arrangement (ie: angle, height) in a single value. When applied to the Reynolds number (Re) within the Nusselt number heat transfer correlation, lacunarity reveals a relationship between convection and solar farm-specific geometry. That correlation can be applied to existing and forthcoming array designs to optimize convective cooling, ultimately increasing production and PV cell life.
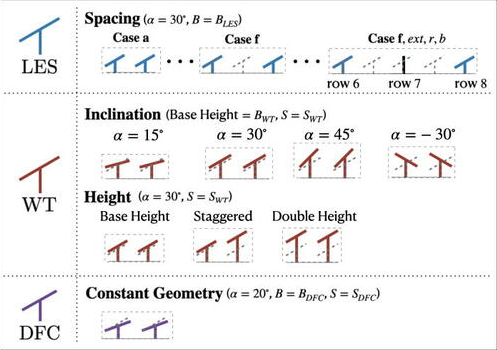
Image: AIP Publishing
More details from the study can be found via AIP Publishing.
This content is protected by copyright and may not be reused. If you want to cooperate with us and would like to reuse some of our content, please contact: editors@pv-magazine.com.


By submitting this form you agree to pv magazine using your data for the purposes of publishing your comment.
Your personal data will only be disclosed or otherwise transmitted to third parties for the purposes of spam filtering or if this is necessary for technical maintenance of the website. Any other transfer to third parties will not take place unless this is justified on the basis of applicable data protection regulations or if pv magazine is legally obliged to do so.
You may revoke this consent at any time with effect for the future, in which case your personal data will be deleted immediately. Otherwise, your data will be deleted if pv magazine has processed your request or the purpose of data storage is fulfilled.
Further information on data privacy can be found in our Data Protection Policy.