
Since the late 2000s, the federal government has supported the solar industry – first through a grant, and later through a tax credit that offset the up-front costs of solar power. In parallel, the wind industry was given a Production Tax Credit (PTC). A PTC works much like the Investment Tax Credit (ITC), since both credits offset tax liability, dollar for dollar. The main difference between the credits is that while the PTC generates credit for each kilowatt-hour produced, for the first ten years of a project’s lifetime, the full value of the ITC is provided up front, immediately offsetting the project’s installation costs.
Now that the Inflation Reduction Act (IRA) has passed, the new law of the land allows the solar industry to choose between the ITC and the PTC for its own projects, starting in 2023.
The base value of the PTC is 0.3¢ per kWh for projects greater than 1 MWac. If your project pays prevailing wages, that value increases to 1.5¢ per kWh. The PTC is then inflation-adjusted by the IRS. For 2022, that value comes to 2.6¢/kWh.
The question now becomes – which tax credit is more valuable? 30% up front, or 2.6¢/kWh for a decade?
Showing off their financial analysis skills, CohnReznick Capital tweeted out this Inflation Reduction Act: Tax Credit Monetization Analysis, which answers whether PTC or ITC will provide a greater tax credit monetization.
Fundamentally, the answer comes down to the upfront cost of a project versus how much electricity a system can actually produce per watt of rated capacity (net capacity factor). If a project is a large-scale facility, with a highly efficient installation technique and great pricing (due to scale), the 30% tax credit is ‘smaller’.
For example, a residential solar project that costs a total of $3.00 per watt to install, will receive a tax credit of $0.90/W. Whereas, a $1/W utility scale facility will receive ‘only’ $0.30/W. Of course, the residential incentive is almost equal to the utility scale price per unit!
The second factor to consider is the quantity of electricity actually generated per watt of solar module capacity. Utility scale projects, without a doubt, have a massive advantage here. The best single axis tracker, bifacial projects in the deserts are near 30% capacity factor. For comparison, the capacity factor for residential solar in the northeast is a little over 10%.
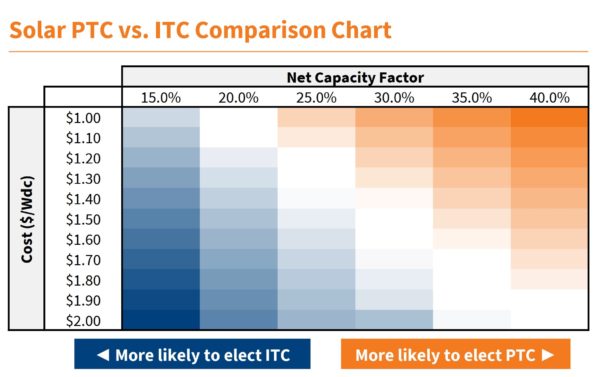
With that, the first chart from CohnReznick Capital (above) shows a comparison of cost and capacity factor. Higher up-front costs, and lower capacity factors (in blue) should go with the ITC. Higher capacity factors, with lower up-front costs, show up as orange, and would benefit more from selecting the PTC. For projects with no clear advantage either way, financial analysts and asset owners will have to make a judgment call based on their perceived opportunity costs.
Cohn notes, “ITC is determined upfront, and may give investors comfort for tax planning and exit timing”, while the, “PTC Tax Equity structure may result in more efficient depreciation monetization (~2x) from a larger TE starting capital account, and no basis reduction.”
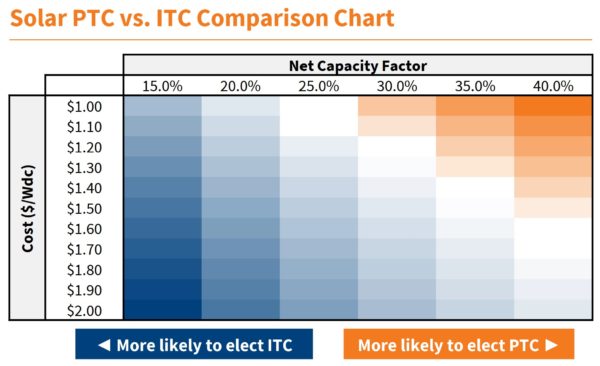
CohnReznick Capital also says that if the asset owners can immediately make use of larger, up front tax credit, then that tax credit becomes more valuable. This shifts the blue area in the chart above roughly 10%, toward the top right region, favoring the ITC.
This content is protected by copyright and may not be reused. If you want to cooperate with us and would like to reuse some of our content, please contact: editors@pv-magazine.com.


By submitting this form you agree to pv magazine using your data for the purposes of publishing your comment.
Your personal data will only be disclosed or otherwise transmitted to third parties for the purposes of spam filtering or if this is necessary for technical maintenance of the website. Any other transfer to third parties will not take place unless this is justified on the basis of applicable data protection regulations or if pv magazine is legally obliged to do so.
You may revoke this consent at any time with effect for the future, in which case your personal data will be deleted immediately. Otherwise, your data will be deleted if pv magazine has processed your request or the purpose of data storage is fulfilled.
Further information on data privacy can be found in our Data Protection Policy.