The United States power grid will soon have a month where it is powered by more than 50% emission-free electricity sources, a milestone which will most likely occur in April or May, and probably in 2024. The emissions free generation is likely to come from approximately 17% nuclear, 7-9% solar, 17-19% wind, and 7% hydroelectric.
Unfortunately, we didn’t quite reach 50% this April, though we did reach 45.4%. Year to date, over 10% of the hours of electricity generated in 2022 have been 50% or more emissions free. According to the Department of Energy’s Energy Information Administration’s (EIA) Hourly Energy Monitor, the tool’s preliminary numbers suggest that around 43% of the electricity in May was generated by non-fossil sources.
However, both wind and solar generated their all time peak values in April of this year – we ain’t slowin’ down, folks!

According to the EIA, solar photovoltaics generated 4.37% of all electricity from the beginning of the year through the month of April, 2022. This value is 23.7% greater than the same period last year. For the month of April, solar made up 6.03% of all electricity – a monthly record. That’s a growth of 18% over April 2021.
Compared to last year at this time, small scale solar is up 21%.
The EIA projects that solar electricity will deliver 5% of all electricity in 2022, a percent increase over the ~4% of total electricity it generated in 2021. Year to date, electricity demand in 2022 (including distributed generation) is up 4.5% over last year.
The increased solar generation is a result of 23.6 GW of US solar deployments in 2021, a new record. According to the Solar Energy Industries Association, 23.6 GW represents 19% more deployed capacity than was deployed in 2020. This volume was large enough that it grew the nation’s solar fleet by over 24%, from 97.7 GWdc of capacity deployed.
This pushed the utility scale solar industry to a record 50 GW of instantaneous generation.
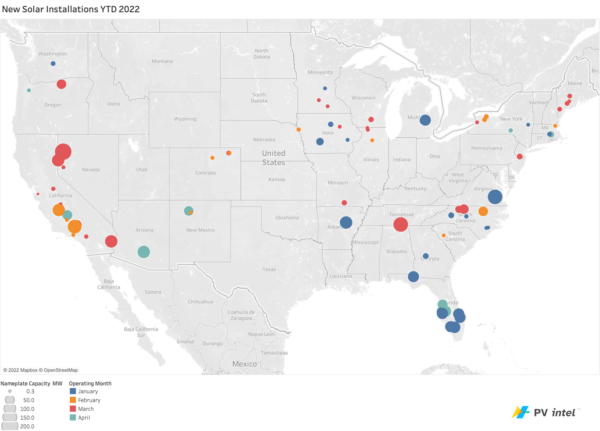
According to SEIA, the first quarter saw 3.6 GWdc of capacity deployed across all project sizes – residential through utility. For the month of April, the EIA notes that 417 MWac of utility scale capacity was deployed across 10 projects.
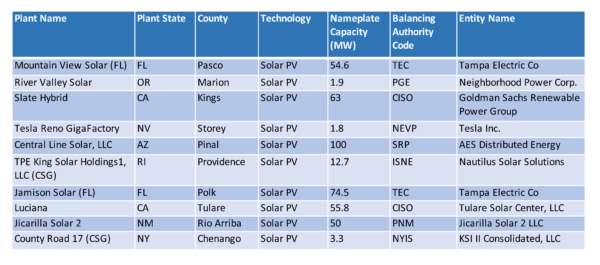
Deployed capacity in April is trending behind the first quarter of the year – which averaged 738 MWac/month across 30 projects/month, per PV Intel data.
In the United States, the fall and spring months have the lowest electricity demand. This is because there is less heating and cooling demand during these temperate weather conditions. The price of electricity often trends down in this period.
Since wind and solar resources generate electricity without fuels and thus without additional costs, they are almost always up and running. Coal and gas tend to shut down during these seasons, to avoid burning fuel during low priced periods, and to perform necessary repairs and upgrades.
These shutdowns allow wind and solar power to take over larger chunks of generation. However, it’s a complex time of the year when we talk about clean electricity generation.
Nuclear power plants also tend to shut down in spring or fall for annual maintenance. Wind power tapers down off its peaks in February and March. Hydroelectric power, historically, is expected to peak in the springtime as snow melts. However, a 1,000 year drought in the Western USA has been reducing hydroelectric output.
And of course, solar generation naturally increases from winter to the summer solstice peak in June.
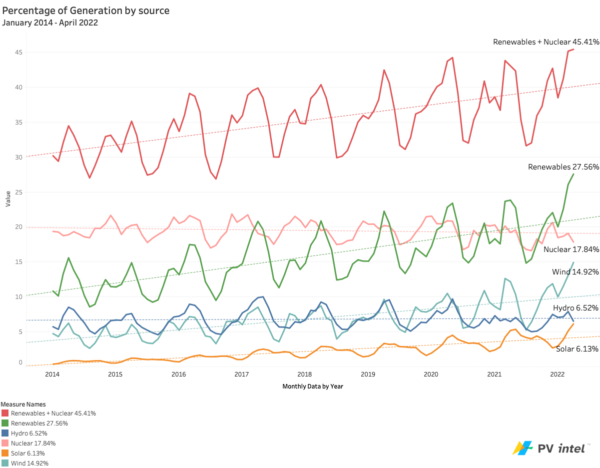
Note that the peaks occur in May and April. The major drop in July and August is a result of summertime air conditioning and natural gas capacity ramping up, as wind generation declines. As the summer cools and open window fall days return, we see emissions free generation climb to a second peak, in November. Then, as winter days grow short, and cold, solar falls off and wind begins to pick up. However, overall emissions free electricity declines in winter, as electricity is used to heat.
As we hit 45.41% of emission free electricity in April this year, this author projects that we will come close to hitting 49% in 2023 and clearly break 50% in 2024. This is based on data that the U.S. has added greater than 3.23% of new emissions free kilowatt hours per year since 2014.
In our favor is wind and solar, deploying massive volumes. Hopefully, additional nuclear facilities will not close, especially since nuclear power has been legislated heavy financial incentives. The Southwest USA hydroelectric situation could pose a serious challenge, depending on whether or not it is able to stabilize.
Jason O’Leary, Principal Analyst at pv-intel.com, contributed to this article with data analysis and data visualization.
This content is protected by copyright and may not be reused. If you want to cooperate with us and would like to reuse some of our content, please contact: editors@pv-magazine.com.


PG&E is down to just 8.5% electrical production from Natural Gas, the only fossil fuel they use. Solar and wind are up to 36.9% and the rest is made up of geothermal, Bio, hydro and Nuclear. The leader is also one of the most expensive to utility users in the country as well.