In the recently released report “States of Distributed Solar,” Institute for Local Self Reliance (ILSR) researcher Maria McCoy looks at which states have the most small-scale solar. States with the greatest capacity have more than 300 watts of rooftop and community solar per capita.
In 2021, a record 18.2 GW of solar generation capacity was installed in the United States. Of that total, 5.4 GW was distributed solar, including a record 500,000 homeowners who installed residential solar systems. Distributed energy resources (DER) are smaller scale solar installations that are connected to lower-voltage distribution grid. Residences and businesses with solar are good examples, where they use the electricity right where it is generated and send the excess to the grid.
The map below from the ILSR report illustrates the saturation of each state’s distributed solar market, relative to population, at the end of 2021.
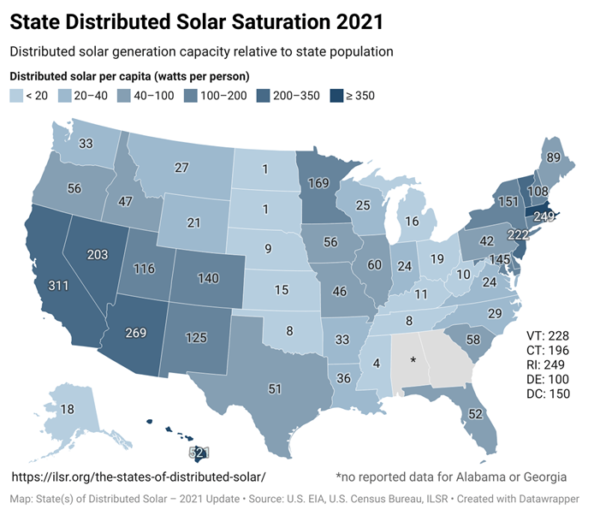
For the purposes of the map, community solar in Colorado, Massachusetts, Minnesota, and New York is included as distributed solar. ILSR added its own figures on state community solar capacity to the US Energy Information Administration’s figures on small-scale photovoltaic capacity by state. This sum was divided by state population estimates from the US Census Bureau, resulting in a figure for distributed solar per capita (watts per person). The US EIA does not collect data for Alabama or Georgia.
Top five states:
- Hawaii: at 750 MW distributed, 521 W per capita
- Massachusetts: at 363 MW distributed, 2,532 W per capita
- California: at 12,200 MW distributed, 311 W per capita
- Arizona: at 1,956 MW distributed, 269 W per capita
- Rhode Island: at 272 MW distributed, 249 W per capita
Although California, Texas, Florida, and North Carolina have the largest overall solar markets, Hawaii, Massachusetts, California, and Arizona have the greatest distributed solar saturation, as measured in installed distributed solar capacity per capita. California, Arizona, Nevada, Massachusetts, and New Jersey all land in the top ten for both distributed solar saturation and total solar generation capacity.
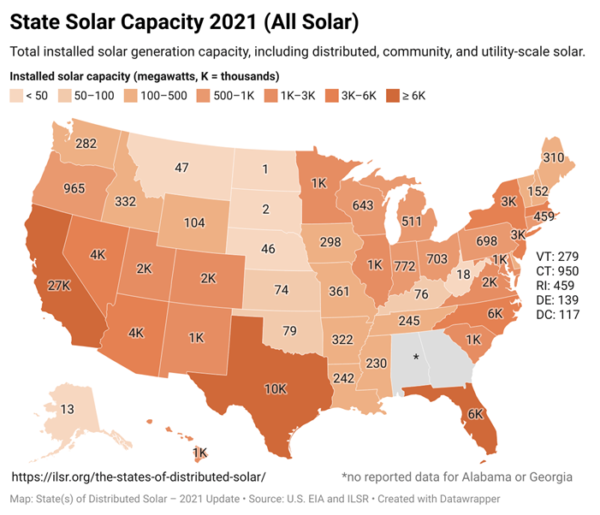
Since the 2020 update, a few states have made remarkable progress. In Texas, California, and Florida, installed capacity grew by more than a gigawatt in 2021 (4.3 GW, 3.0 GW, and 1.5 GW, respectively). Virginia’s installed solar capacity grew by just under 1 GW (955 megawatts). In Maine, Ohio, Illinois, and Wisconsin, solar capacity was doubled since 2021. Indiana, Iowa, Colorado, and Michigan also saw rapid expansion of solar generation capacity. Eighteen states can now claim more than 1,000 megawatts of total solar capacity and 40 have more than 100 MW.
Community solar
Community solar is another example of distributed energy and it is currently available in 20 state and the District of Columbia. These installations offer the same electric bill stability and savings as rooftop solar, but operate remotely under a subscription model. In three years, the Biden Administration targets 5 million US households to be served by community solar, leading to an estimated $1 billion in utility bill savings. Recently, New York State surpassed 1GW of total community solar capacity, edging out Minnesota as the top state for development.
Community solar installations– larger than residential solar installations, but smaller than utility-owned solar fields — are the most cost-effective size for solar. The following graphic highlights the four community solar-enabling states — Colorado, Massachusetts, Minnesota, and New York. The figures for community solar saturation are calculated by dividing installed community solar capacity by state population.
This content is protected by copyright and may not be reused. If you want to cooperate with us and would like to reuse some of our content, please contact: editors@pv-magazine.com.


By submitting this form you agree to pv magazine using your data for the purposes of publishing your comment.
Your personal data will only be disclosed or otherwise transmitted to third parties for the purposes of spam filtering or if this is necessary for technical maintenance of the website. Any other transfer to third parties will not take place unless this is justified on the basis of applicable data protection regulations or if pv magazine is legally obliged to do so.
You may revoke this consent at any time with effect for the future, in which case your personal data will be deleted immediately. Otherwise, your data will be deleted if pv magazine has processed your request or the purpose of data storage is fulfilled.
Further information on data privacy can be found in our Data Protection Policy.