Researchers in the US Department of Energy’s Lawrence Berkeley National Laboratory (LBNL) have found that utility-scale solar power facilities have increased their panel density by 43-52%, which boosted electricity generation per acre by 25-33%, even as more facilities are coming online in northern locations that receive less sunlight.
In the paper, Land Requirements for Utility-Scale PV: An Empirical Update on Power and Energy Density, the team notes that it has been ten years since the last official update to the national benchmark for solar plant power and energy density. The group reviewed all solar plants greater than 5 MWac, from 2011 through and including 2019 installations.
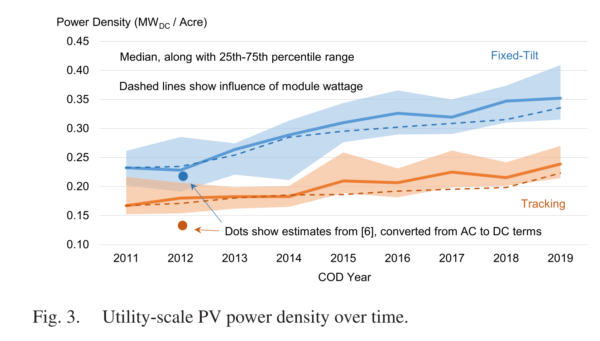
They found that the median power density (MWdc/acre) increased by 52% for fixed tilt facilities, and increased by 43% for single axis trackers. As a result, LBNL suggested new national benchmarks for density:
- .35 MWdc/acre (0.87 MWdc/hectare) for fixed-tilt
- .24 MWdc/acre (0.59 MWdc/hectare) for tracking plants.
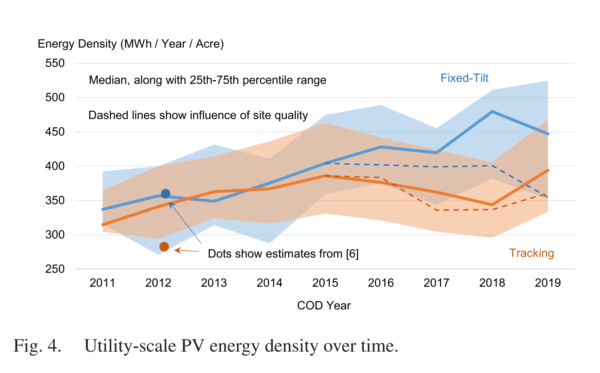
Concurrently, the electricity generation of these facilities — measured in MWh/year/acre — has increased by 33% for fixed tilt and 25% for tracking. LBNL suggests updating the national benchmarks for electricity generation, as well:
- 447 MWh/year/acre (1.10 GWh/year/ hectare) for fixed-tilt
- 394 MWh/year/acre (0.97 GWh/year/hectare) for tracking plants
The sample found that 736 plants, totaling 27,001 MWac/35,482 MWdc, came online from 2007 through 2019 – roughly 92% of all utility scale facilities to come online during that period. Due to limited data from 2007 through and including 2010, their analysis only covers 2011-2019.
The researchers used ArcGIS to draw polygons around satellite imagery of each plant. The software then calculated the area within the shapes. This data was cross referenced with other facility metadata to arrive at the power (MW/acre) and energy (MWh/acre) density.
The analysis found that increases in a site’s solar panel density are highly correlated with solar panel efficiency. In Figure 3 near the top of the article, Utility Scale PV Power Density, we see the dashed lines – representing efficiency — moving in tandem with site density, both figures increasing.
One reason that tracking facilities haven’t benefited as much from increasing solar panel densities, is that tracking systems were the first to use the highest efficiency panels — and thus further gains in efficiency over this period have been smaller.
However, looking at electricity generation per acre in Figure 4, the picture is a bit more complex. Generation is still increasing; however, we can see dashed lines representing ‘site quality’ have actually remained flat or decreased since 2015.
Site quality is defined by the long term average global horizontal irradiance (GHI) (kWh/m2/day) – that’s the amount of sunlight that hits the ground. Since the start of this research, minus a bump in 2019, both fixed tilt and tracking solar power projects have seen their available sunlight decrease. And the construction of fixed tilt racking systems has moved way north.
It was determined that the ground cover ratios — the amount of land that would be covered if the modules were laid flat — typically range from 40 to 50% for fixed-tilt plants, versus 25-40% for tracking plants. But this value varied greatly by site, as it is based upon terrain, tilt, and other land features.
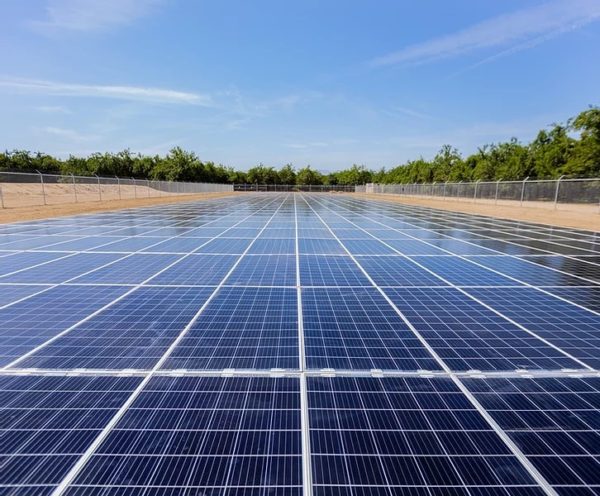
Experiments in panel layout, such as Erthos (above), might aggressively increase the volume per acre by laying the panels flat on the ground. A facility like this could potentially have a ground coverage ratio greater than 85%, leaving only the land between the fence and the solar uncovered.
However, until there is greater performance data, we don’t know if the power generation density will increase over the long term.
Currently, even with all land use and panel and generation density data, single axis trackers are the de facto standard for utility-scale solar power projects with the lower levelized costs of electricity. It speaks to the reality that there’s plenty of land available, and that hardware that is slightly more expensive, but highly more productive, still controls the market.
This was amended on March 8, 2022, to add decimal point before figures in suggested national benchmarks for density.
This content is protected by copyright and may not be reused. If you want to cooperate with us and would like to reuse some of our content, please contact: editors@pv-magazine.com.


By submitting this form you agree to pv magazine using your data for the purposes of publishing your comment.
Your personal data will only be disclosed or otherwise transmitted to third parties for the purposes of spam filtering or if this is necessary for technical maintenance of the website. Any other transfer to third parties will not take place unless this is justified on the basis of applicable data protection regulations or if pv magazine is legally obliged to do so.
You may revoke this consent at any time with effect for the future, in which case your personal data will be deleted immediately. Otherwise, your data will be deleted if pv magazine has processed your request or the purpose of data storage is fulfilled.
Further information on data privacy can be found in our Data Protection Policy.