PV Evolution Labs (PVEL) released its 2021 Reliability Scorecard. The annual publication is a collection of results from solar panel stress tests focused on specified and verified subcomponent bills of materials.
A few highlights from this year’s results:
- The highest failure rate for a part, submitted by one-third of manufacturers, was junction box failure. These failures were observed visually prior to testing, offering a simple checkpoint for installers as solar panels are unpacked onsite.
- New solar cell technologies and general practices – multi cut cells, monocrystalline, multi-busbar – are showing strong performance characteristics versus their predecessors of single large cells, multicrystalline, and 3-4-5 busbars.
- Thin film, IBC, and glass-glass solar panels show lower levels of degradation. This aligns with 25 years of First Solar observations, SunPower’s 40 years of useful life argument, as well new warranties from glass-glass module manufacturers.
The group’s newest product test – the Mechanical Street Sequence (MSS) – seeks to discover how larger solar panels–built from larger solar cells–which are now deployed in more complex environments, will potentially develop microcracks and degrade over the next several decades.
PVEL said that its MSS aligns with the forthcoming IEC 63209 technical specification for extended reliability testing. It said the IEC 61215 certification standard only requires static mechanical loading, and PV modules will pass if they exhibit no visible damage when evaluated by eye and have less than 5% power loss.
To start all testing processes, including this MSS, PVEL observes the production of each solar panel they test, from the opening of the raw materials through every step of production, until they are palletized and shipped with tamper-proof tape. The below electroluminescence imaging shows a panel’s progression through the three main steps of MSS – static mechanical load (SML) – #2, dynamic mechanical load (DML) – #3, and environmental stress – #4.
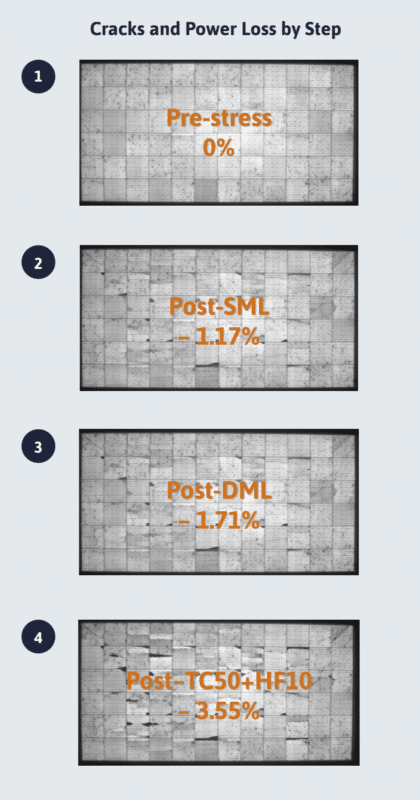
In the SML testing phase, modules are mounted on two rails and secured at typical ground-mount clamping locations. They then undergo three rounds of one-hour downforce and one-hour upforce at 2,400 pascals.
For the DML testing, there are 1,000 cycles of alternating positive and negative loading at 1,000 pascals. As part of the simulated environmental stress, modules undergo 50 thermal cycles from +85°C to -40°C, then 10 cycles of humidity freeze, high heat, and humidity followed by a rapid drop to freezing temperatures.
The report said that, in general, solar panels from the last five years show higher levels of field degradation. This should not be too surprising as more than half of the world’s solar deployment has occurred over the same time period.
If we were to focus on one technology among the many which make up a modern solar panel, the report suggested that module encapsulation should get our attention. Variations in the encapsulant formulations were the primary factor affecting the degradation rate.
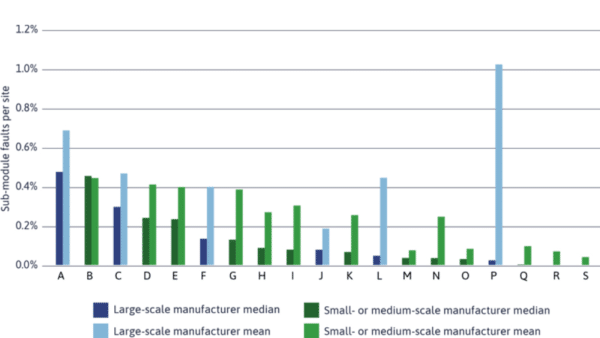
An aerial-infrared analysis that submitted with the report by Heliolytics, found that a manufacturer’s size does not correlate with field reliability. As we can see in the chart, below, large and small scale manufacturers (blue versus green, respectively) are evenly mixed.
The list of manufacturers with a bill of materials that performed well enough to garner a spot on the PVEL Top Performers list can be found in their Twitter feed. Below, we’ve highlighted the manufacturers that made the list for the first time this year:
While the solar panel failure rates noted here are trivial for residential and small commercial customers with even 100 panels, the higher failure rates will add significant labor hours when it comes to gigawatt-scale facilities.
This content is protected by copyright and may not be reused. If you want to cooperate with us and would like to reuse some of our content, please contact: editors@pv-magazine.com.


By submitting this form you agree to pv magazine using your data for the purposes of publishing your comment.
Your personal data will only be disclosed or otherwise transmitted to third parties for the purposes of spam filtering or if this is necessary for technical maintenance of the website. Any other transfer to third parties will not take place unless this is justified on the basis of applicable data protection regulations or if pv magazine is legally obliged to do so.
You may revoke this consent at any time with effect for the future, in which case your personal data will be deleted immediately. Otherwise, your data will be deleted if pv magazine has processed your request or the purpose of data storage is fulfilled.
Further information on data privacy can be found in our Data Protection Policy.