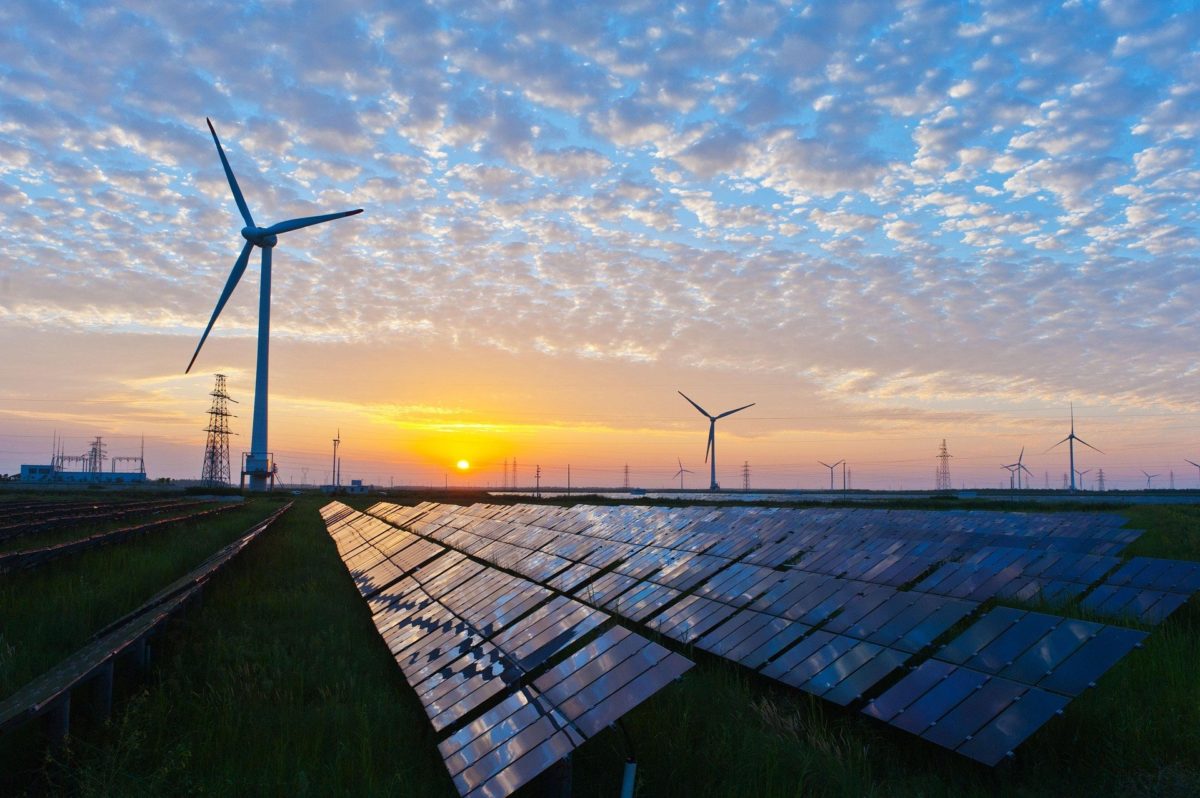
U.S. renewable installations started the year off strong, as 15 utility-scale solar projects and two energy storage projects became operational during the first quarter. That was alongside a 40% increase in new wind capacity compared with the first three months of 2020, according to the most recent Clean Power Quarterly Market Report, released by the American Clean Power Association (ACP).
The U.S. clean energy industry installed a record-breaking 3,859 MW of clean power capacity in the first quarter. That was a 10% bump over the first quarter of 2020, supplanting it as the highest quarter on record.
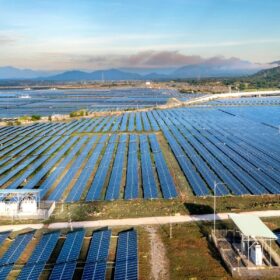
The 38 new projects were constructed across 17 states. Texas led the pack with 791 MW installed, followed by Oklahoma (555 MW), California (519 MW), South Dakota (462 MW), and North Dakota (299 MW).
With this record quarter, more than 173 GW of clean power capacity is in service in the U.S.
Solar represented the largest share in the clean power pipeline (44,442 MW), accounting for 53%. There were 651 solar projects in advanced development in 45 states and the District of Columbia. Texas hosted more activity than any other state with 19% of the total solar pipeline, followed by California with 13%, North Carolina with 8%, and Indiana with 7%.
Q1 also marked the entrance of a truly massive solar project into the development pipeline: the 700 MW Dunn’s Bridge solar-plus-storage project in Indiana. Once operational, the project will be the largest solar facility in the state by a wide margin.
On the storage side, there was 7,174 MW of battery storage capacity in the project pipeline, including 3,533 MW in advanced development and 3,641 MW under construction, representing 8% of total development activity.
Storage activity was spread across 137 project phases in 15 states. California leads with more battery storage activity than any other state, representing 39% of combined storage pipeline activity. Texas came in second with 15%, followed by Nevada with 14%, and Florida with 6%.
Just as a behemoth solar project began development in Q1, an equally impressive storage installation began construction: the 409 MW Manatee Solar Energy Center in Florida. It would rank as one of the world’s largest solar powered energy storage projects. Once operational, the storage project would be able to power Walt Disney World for an estimated seven hours.
This content is protected by copyright and may not be reused. If you want to cooperate with us and would like to reuse some of our content, please contact: editors@pv-magazine.com.


Those are some impressive numbers. Hope in a couple of years they are the new normal.