
Buying and selling solar energy is complicated by constant changes in weather, congestion on nearby transmission wires, project downtime for maintenance or repair, and other market conditions outside of an owner or buyer’s control.
REsurety has identified four key insights on how solar markets performed in 2020, as well as the data behind them.
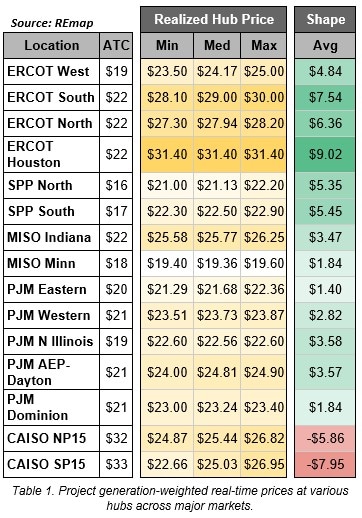
1. Texas solar outshines all others. The value of utility-scale solar project generation in 2020 ranged from around $19/MWh in MISO (Midcontinent Independent System Operator) to roughly $31/MWh in ERCOT (Electric Reliability Council of Texas). Here, value is measured as the value of project generation, sold at the real-time Locational Marginal Price (LMP) at the hub, and where project generation is either observed or modeled depending on data availability.
Overall, realized values hovered relatively close to the market average of roughly $25/MWh at the hubs reviewed. Only projects with a full year of data (and thus had become fully operational prior to 2020) were included in our analysis.
The highest realized prices of 2020 were in ERCOT, where solar is expected to—but hasn’t yet—come online in impressive numbers in the next couple of years. Solar projects that are able to be built and fully operational sooner rather than later will likely take advantage of a positive solar shape scalar (defined as the ratio between the as-generated value of power and the around-the-clock value of power). However, solar shape degradation is sure to arrive in Texas as it already has in California.
Here is a summary of project values observed in 2020 across various markets. Note that ATC refers to the around-the-clock hub price:
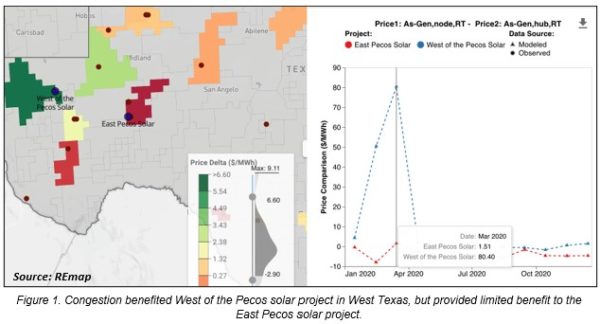
2. Localized congestion chooses winners and losers. The highest-value solar project in ERCOT this past year was in far west Texas. In spring 2020, “West of the Pecos Solar” benefited from local congestion that elevated node-to-hub basis to a high of over $80/MWh in March.
Unfortunately for nearby solar projects, the benefits of congestion were not widespread; most other projects saw limited benefit from the localized congestion, and some were negatively impacted. Being on the right side of congestion will continue to be a key determinant to a project’s financial success.
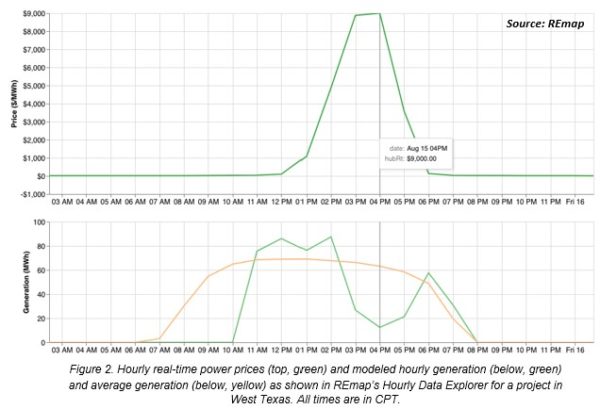
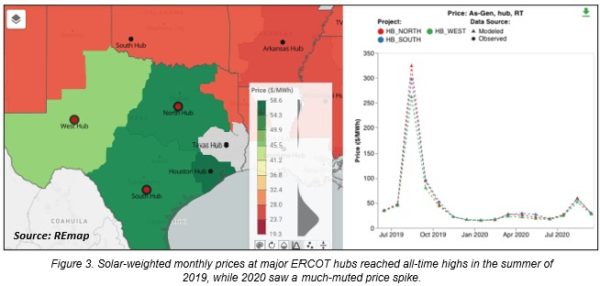
3. Are we past the days of $9,000/MWh pricing? Most project owners and operators in Texas remember that exceptional summer of 2019 when real-time power prices met their upper limit of $9,000/MWh for the first time in ERCOT’s history.
This was welcome news for solar project owners and offtakers, provided the project was operational and generating during those exceptionally high-priced hours.
The situation was painful for any renewable energy project (wind or solar) that was not generating due to operational outages or poor resource availability and still had to meet any firm volume commitments (as detailed in our P99 Hedge That Wasn’t white paper).
This is precisely what happened on Aug. 15, 2019, between 3 p.m. and 4 p.m. Cloud cover developed over much of West Texas, causing a drop in solar generation that contributed to real-time power prices reaching $9,000/MWh. Solar projects with a fixed volume swap and affected by the cloud coverage were left in a very painful financial position, as they would need to pay market prices for the generation they were short under their contract.
In 2020, Texas experienced significantly lower power prices. ERCOT West ATC real-time prices averaged $33/MWh in August 2020, compared to $131/MWh in August 2019, a 75% drop.
Solar-specific value dropped as well: Solar generation in the ERCOT West region was worth just $52/MWh in August 2020, an 80% reduction in value from August 2019.
One thing is clear: Projects and offtakers that benefited from 2019’s volatility were much less profitable in 2020. For solar projects with firm volume commitments, summer 2020 offered a reprieve, as lower weather-driven volatility resulted in more stable contract performance.
Projects and offtakers alike in Texas will be watching the weather closely in 2021, as they remain highly sensitive to price volatility and whether or not their projects are performing as expected during high-priced hours.
4. Solar in CAISO stabilizes after five years of shape decline. After five years of consistent degradation in shape scalar, solar projects in CAISO (the California Independent System Operator region) bounced back in 2020 with a slight uptick in value.
 While solar shape remained near record lows of around 80% of the ATC price, this is a material uptick from the prior year’s value, which for many California solar projects was below 70%. The increase is attributable in part to price spikes driven by the heatwave in August.
Going forward, we will be watching this shape value closely as hundreds of megawatts of battery storage capacity come online in 2021 and increase the grid’s ability to shift solar generation to meet market demand.
Adam Reeve is senior vice president of REsurety Inc. Learn more about REmap or email remap@resurety.com.
The views and opinions expressed in this article are the author’s own, and do not necessarily reflect those held by pv magazine.
This content is protected by copyright and may not be reused. If you want to cooperate with us and would like to reuse some of our content, please contact: editors@pv-magazine.com.


I remember reading about CPS Energy in San Antonio with the 2019 peak pricing talking about how they were making money hand over fist with their coal generation. Just saw an article yesterday about them shutting it down even though it is only 10 years old and what to replace it with. Less than 2 years later. ERCOT solar capacity additions this year and next year going to have a monster year.
Seems like the diminishing value of solar is going to drive storage in ERCOT and you can see that with their connection queue with 26GW of batteries proposed.