
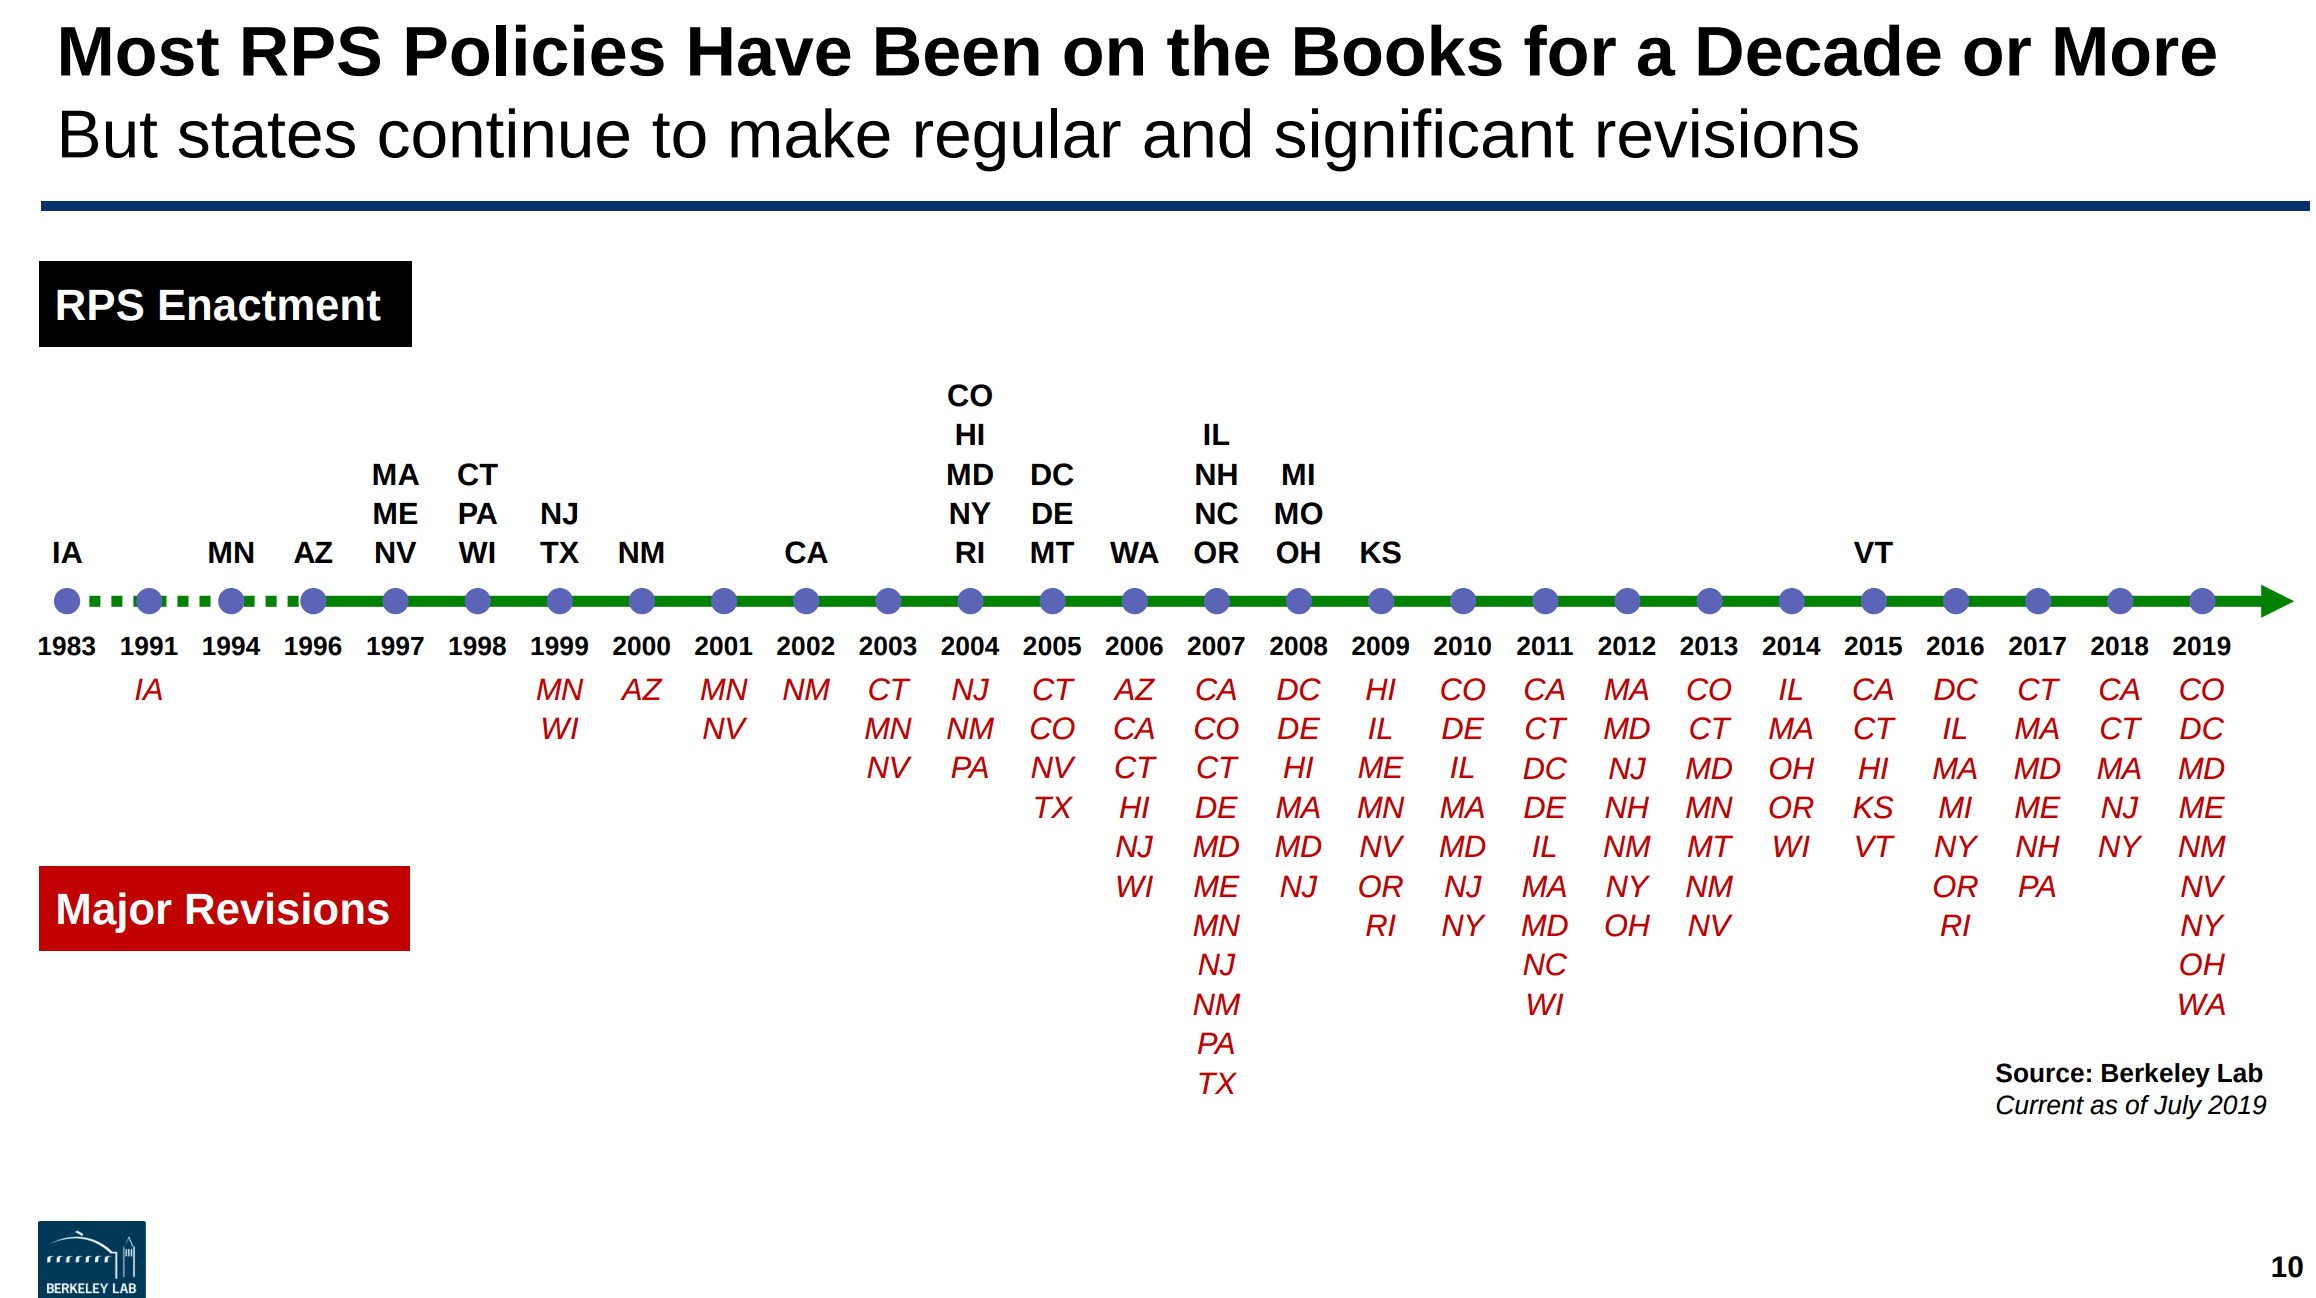
Renewable Portfolio Standards (RPS) are laws in 29 states plus Washington DC that require utilities to source an increasing amount of the energy they generate or sell from renewable sources – and have been around since this author was four (below image). Per U.S. Renewables Portfolio Standards: 2019 Annual Status Update, put out by very prolific researcher Mr. Galen L. Barbose at the Lawrence Berkeley National Laboratory, the majority are more than a decade old, are regularly updated by implementing states and represent more than 73 GW of new renewable capacity by 2030.
And by required, we mean a legal requirement to be built, and a market to consider investment in.
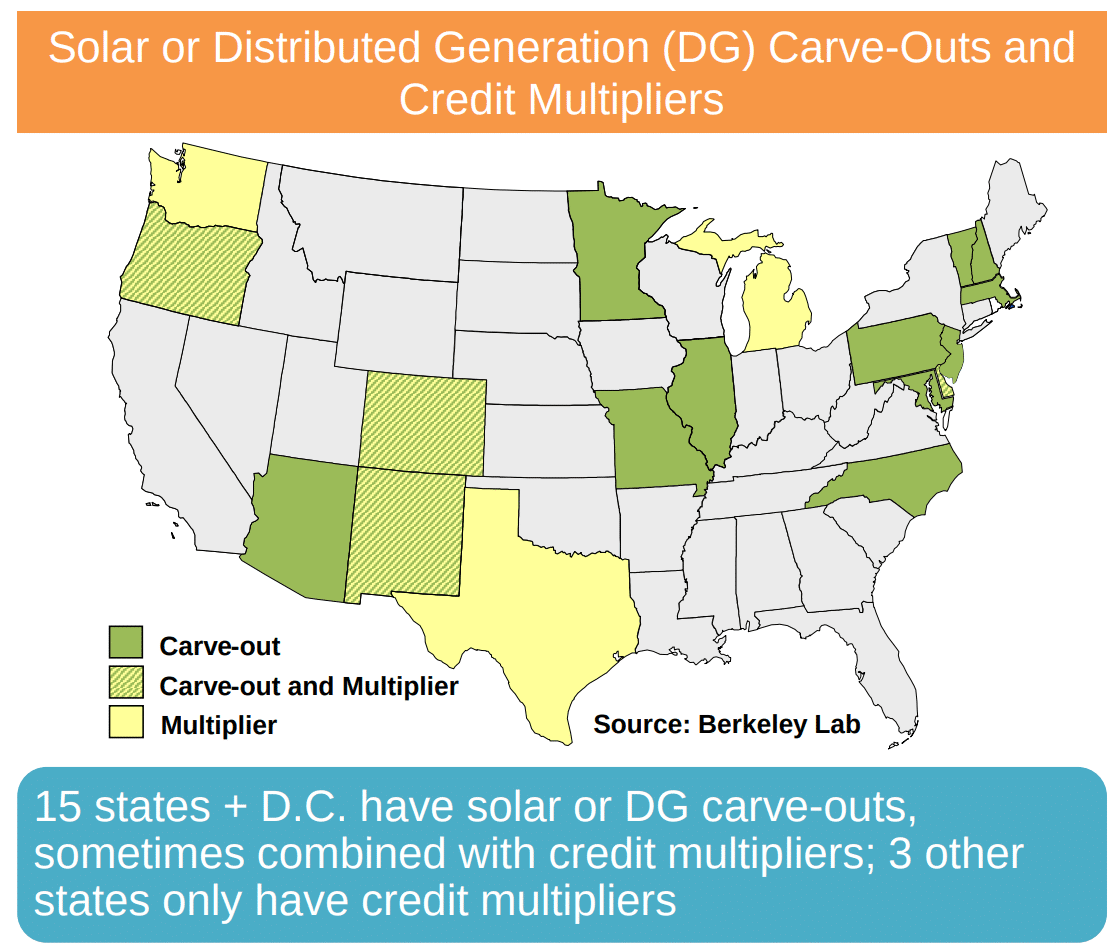
By the end of 2029, there will be a regulatory requirement of producing greater than 551 terawatt-hours (TWh) per year of electricity from renewable portfolio sources, with 83% or 459 TWh of that coming from wind and solar power. Specifically, solar power carve-outs in 15 states represent 21 TWh. Meeting these values will represent 12% of all U.S. electricity sales, which means greater than 17% of all electricity will come from renewables (due to much renewables capacity being outside of RPS mandates). This 17% value is lower than the U.S. Department of Energy/Energy Information Agency’s projections that 19% of power will come from wind and solar by 2030.
Specifically, I’d like to point out this document – RPS Demand Projections (xlsx) – to any business development professionals. It breaks out, on a state by state basis, the exact amounts of electricity needed on an annual basis on a state by state, RPS, and solar basis. Essentially, we’ve been given a map for applying our limited resources going forward.
The report points out that there are “major variations across states” (below image). The variations included percentages and timeframes, who is obligated and exempted within the state, the types of technology, where they’re located within the state, what they track when installing, contractor requirements, and more. In the 15 states that have solar power carve outs, they topped out at 7% of Massachusetts retail sales – but were mostly below 3%.
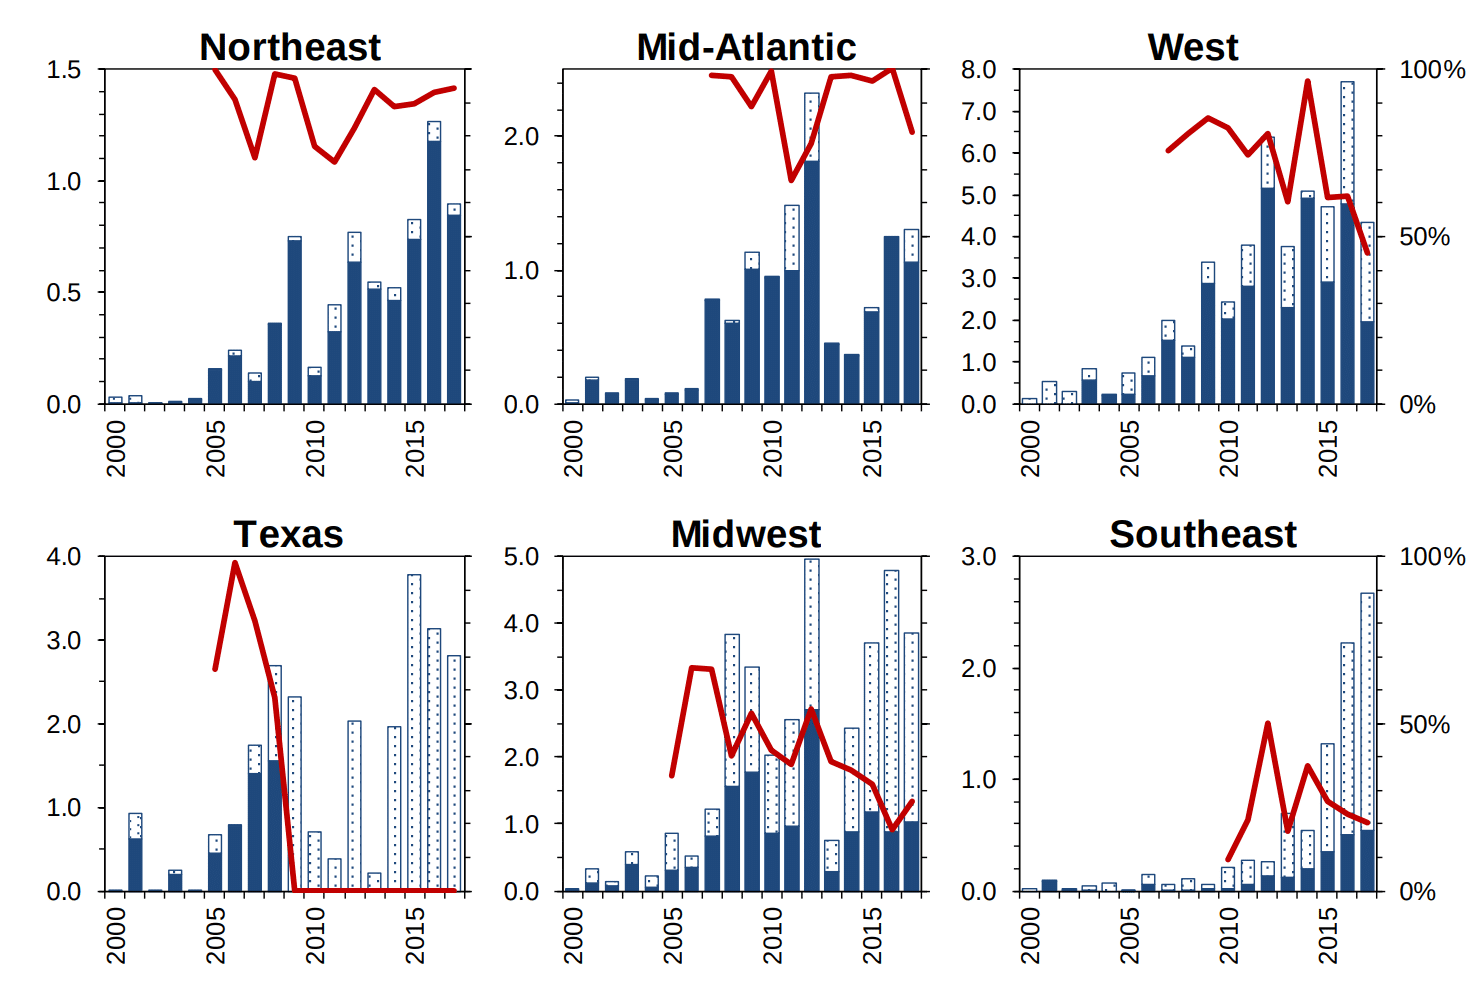
Certain regions have far outpaced their local RPS requirements. For instance, Texas and the Midwest have requirements of roughly 20 TWh, but are producing greater than 60 and 100 TWhs/year, respectively. The Southeast, as of the time of this report, had essentially zer0 requirements, but was producing almost 20 TWh/year of non-hydro renewables. As the authors of the paper pointed out, renewable capacity will come from many places other than RPS requirements.
Over the past decade, roughly 50% of the 154 GW of renewables deployed were to meet RPS standards, being as high as almost 80% in 2007 but falling to less than 30% by 2018. These values vary greatly by region though (below).
An interesting nugget – 9 GW of RPS requirement meeting renewables have been built in non-RPS states, and wheeled into the state via power lines.
The cost of these programs increased the cost of electricity by 1.8¢/kWh, and roughly $4.7 billion in 2018. These values increased from 1.5¢/kWh and $4.0 billion in 2017. This represents a weighted average of 2.6% of electricity bills, ranging from 0.3% to 5.8% of electricity bills across the United States. The author notes that due to many states having varying techniques for representing the cost of renewables (or the avoided costs), cost increases in the past few years were “muddied” by California.
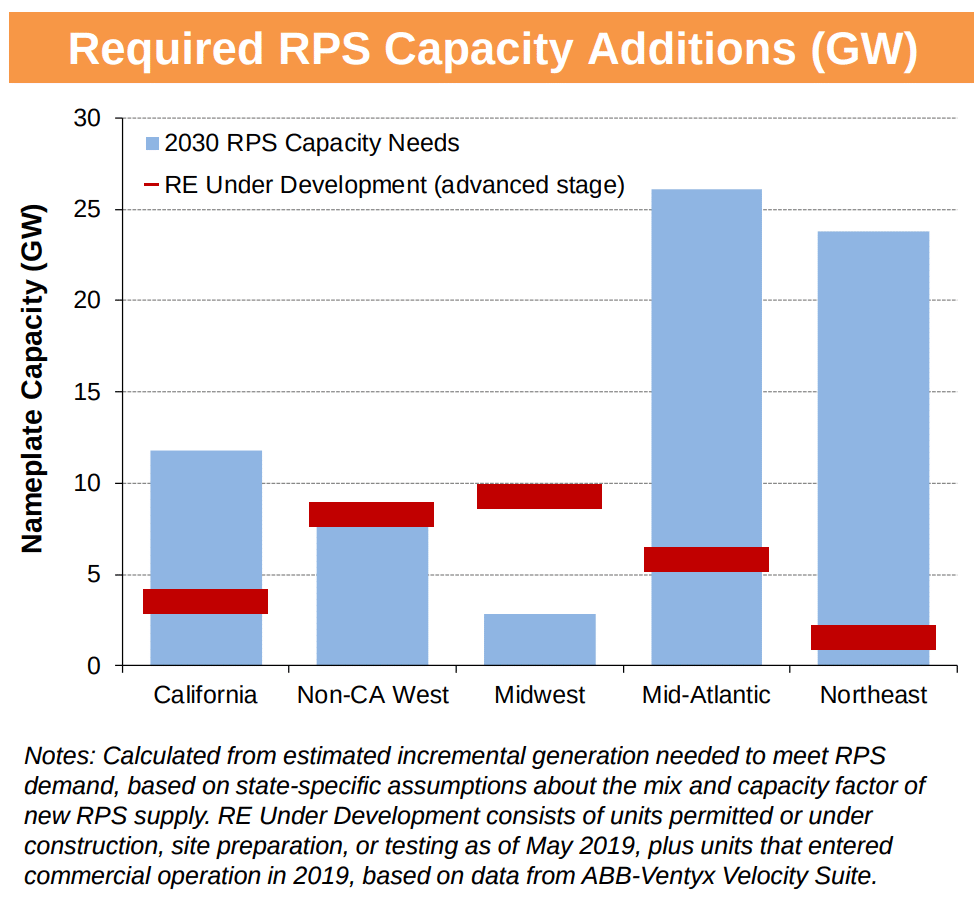
The actual capacity that will be deployed by 2030 to meet these requirements is projected to be 73 GW (below image), 11 GWac of that being solar power and 10 GW being offshore wind. Noted below is that the Midwest and non-California western states are way beyond their RPS values, but that the Atlantic Coast, Northeast and California have a lot of volume to deploy to meet their very aggressive mandates. The report also notes that there will be some renewables that retire (or are repowered) in this period, and that this volume isn’t represented in the document.
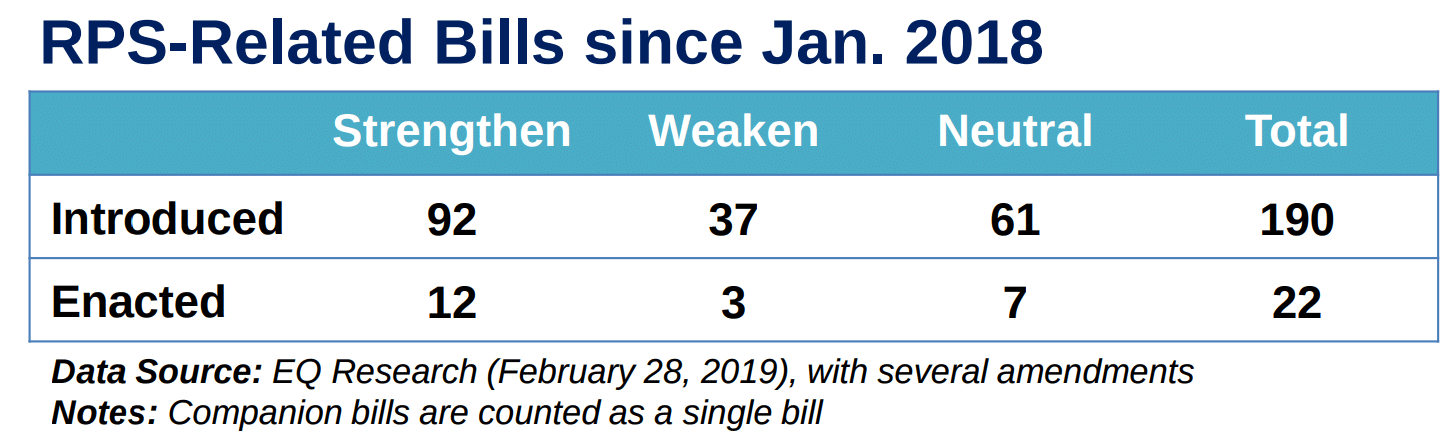
And while past results are not indicative of future performance (100% in New Mexico, Washington, California, etc.), there is good reason to assume that the values reported above will increase. The report shows RPS-related activity is regularly being discussed across the nation (below image), with 190 bills introduced in a year-long period, and 12 strengthenings versus 3 weakenings.
This content is protected by copyright and may not be reused. If you want to cooperate with us and would like to reuse some of our content, please contact: editors@pv-magazine.com.


By submitting this form you agree to pv magazine using your data for the purposes of publishing your comment.
Your personal data will only be disclosed or otherwise transmitted to third parties for the purposes of spam filtering or if this is necessary for technical maintenance of the website. Any other transfer to third parties will not take place unless this is justified on the basis of applicable data protection regulations or if pv magazine is legally obliged to do so.
You may revoke this consent at any time with effect for the future, in which case your personal data will be deleted immediately. Otherwise, your data will be deleted if pv magazine has processed your request or the purpose of data storage is fulfilled.
Further information on data privacy can be found in our Data Protection Policy.