Researchers have developed a matrix (below chart) that shows 15 unique solar installation types and twenty potential “techno-ecological” benefits that arise from them. The matrix is coupled with descriptions of each of the 15 installation types, as well links to research which often times goes into deep technical and financial details on the techniques.
 Dr. Rebecca R. Hernandez of UC Davis and a team of 15 researchers contributed to Techno–ecological synergies of solar energy for global sustainability. The document’s opening line notes: “the strategic engineering of solar energy technologies—from individual rooftop modules to large solar energy power plants—
can confer significant synergistic outcomes across industrial and ecological boundaries.”
In prior writing on pv magazine USA, we’ve suggested that solar power has a looming land responsibility, but that there is much hope. We’ve seen cost effective techniques evolve that increase the environmental value of solar deployments. In order for the knowledge of these techniques, policy makers have to learn of this information from solar industry professionals – for instance – just yesterday we reported on Tyler Norris, an employee of Cypress Creek Renewables, taking time from his schedule to present to the state of North Carolina on the values of adding energy storage to the current 5.4 GW of solar in the state. In that presentation Norris used documentation developed with North Carolina university resources.
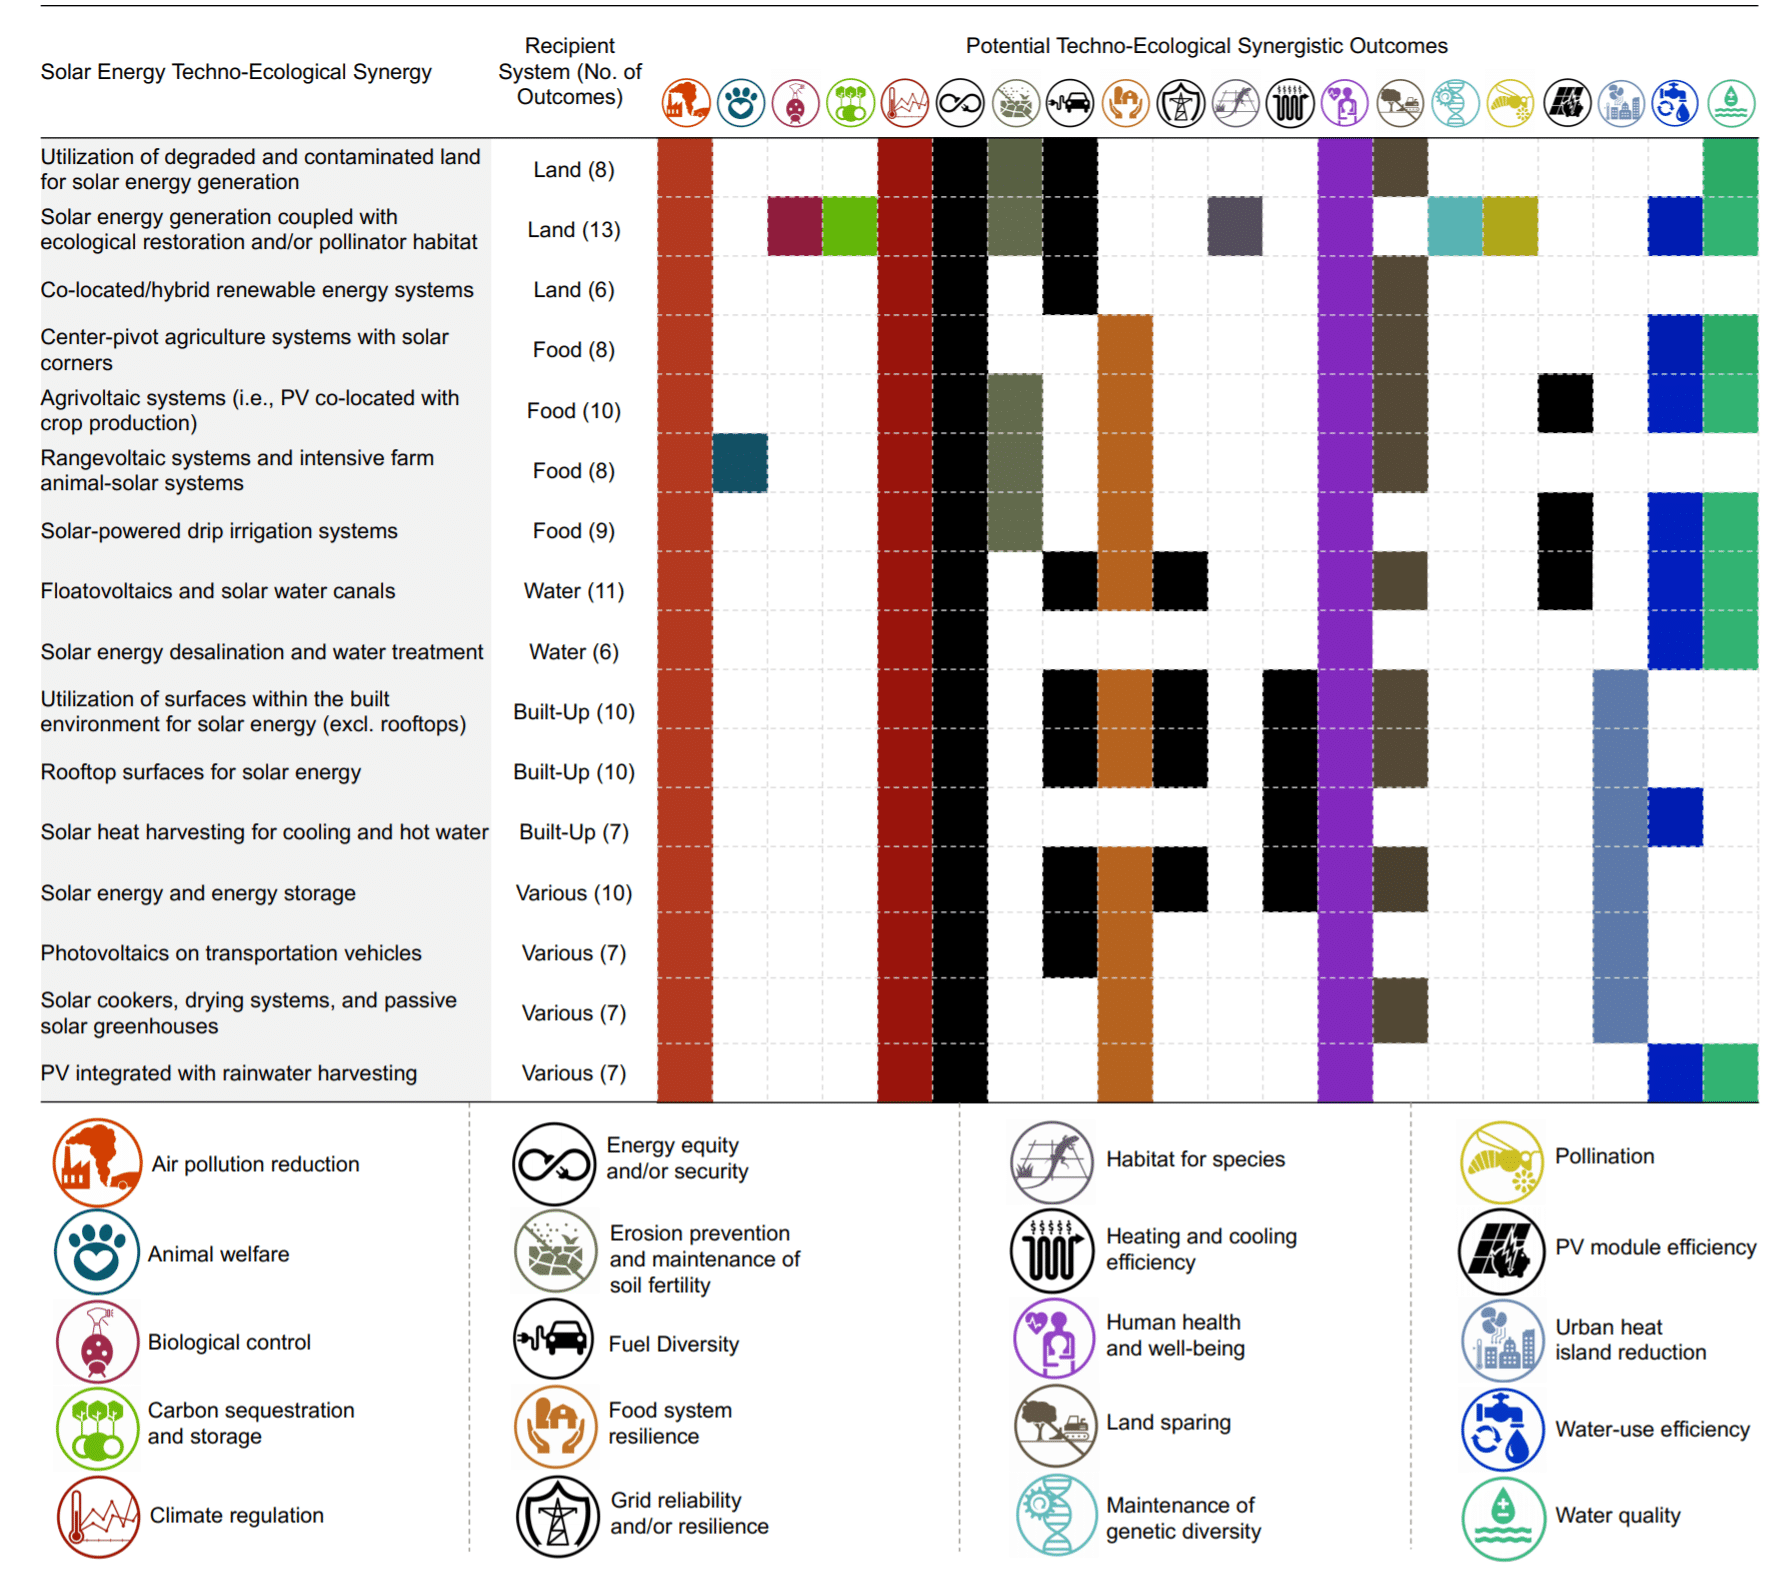
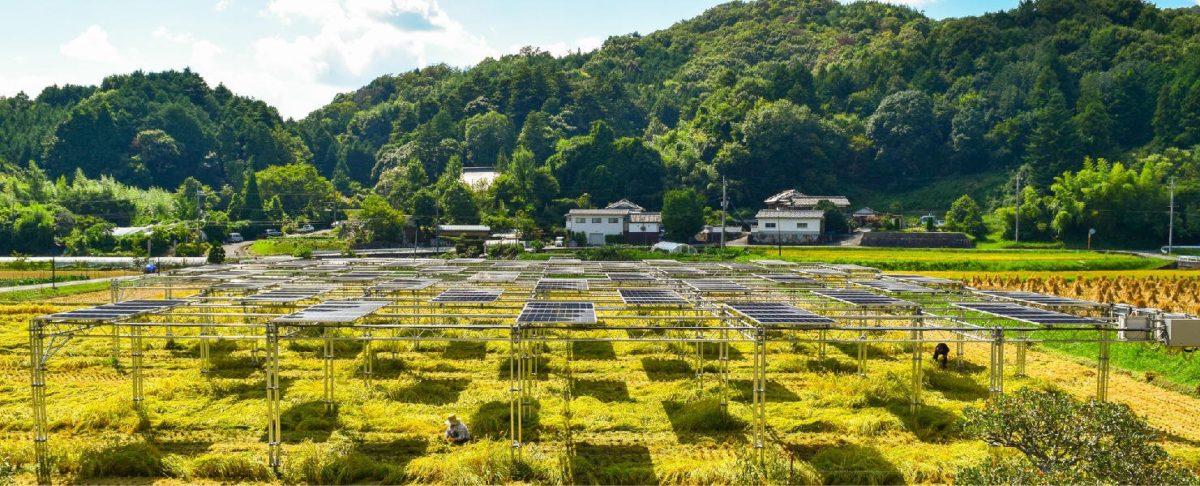
The team covers solar installation techniques such as use of degraded and contaminated land, coupled with ecological restoration and/or pollinator habitat, co-located/hybrid renewable energy systems, centre-pivot agriculture systems with solar corners, agrivoltaic systems (PV co-located with crop production, “rangevoltaic” systems and intensive animal–solar energy systems, solar-powered drip irrigation systems, floatovoltaics and solar water canals, solar energy desalination and water treatment, solar+cars, and some normal items like rooftop and solar+storage. The paper also described the “spacial and temporal” nature of the benefits – when they’ll occur nearby and now or be felt more broadly over longer time periods. For example, pollinators benefits might be felt both locally and immediately upon solar plant completion, while climate regulation will be felt over millennia and globally.
Some of the “potential techno–ecological synergistic outcomes” include air pollution reduction, animal welfare, biological control, carbon sequestration and storage, water quality, water use efficiency, urban heat island reduction, pollination, land sparing, food system resilience, grid reliability and/or resilience, fuel diversity and more.
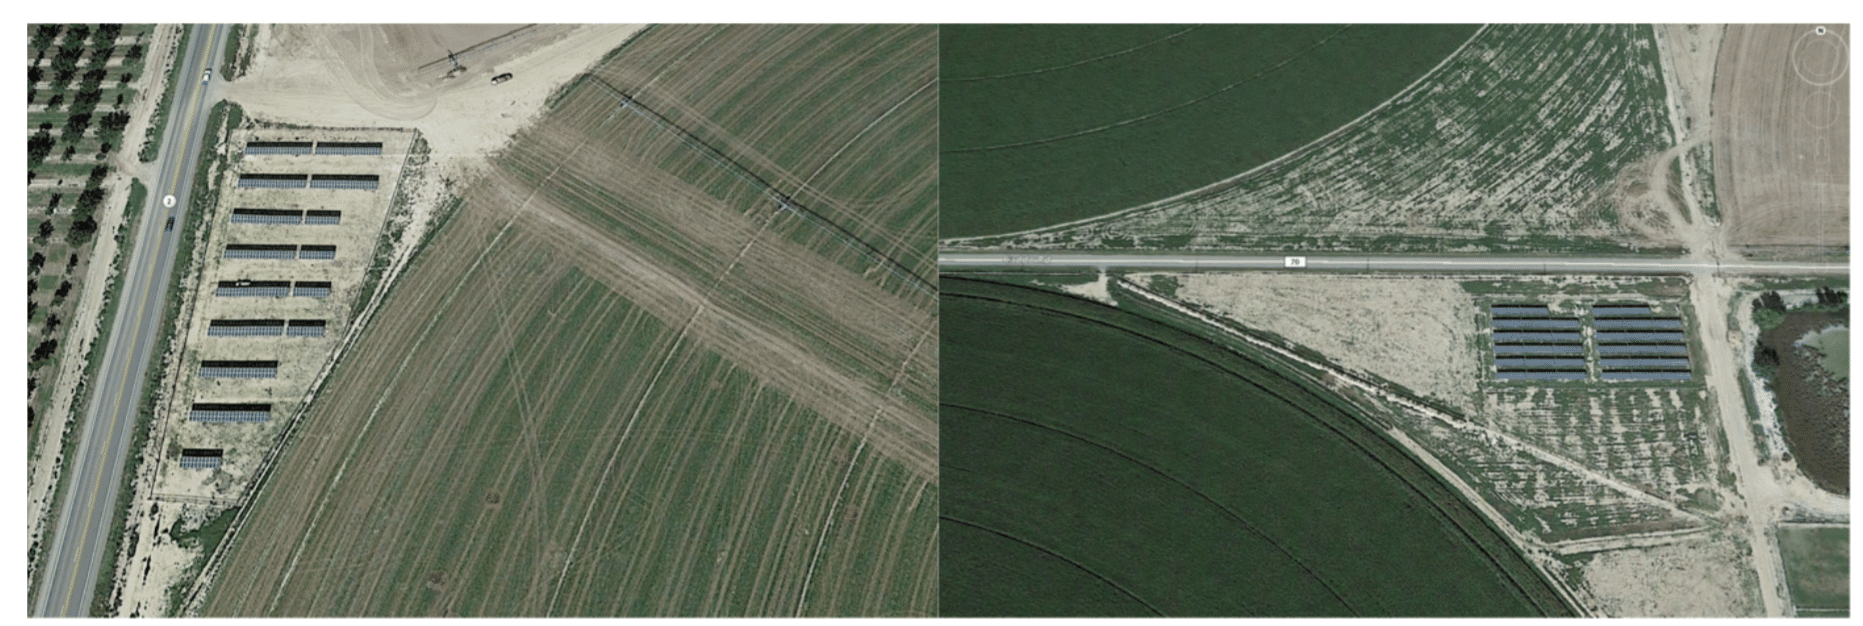
One deployment technique was to install solar power in “negative spaces”, and one specific use case of that is use the unused corner space of “center-pivot farms” (above image). The document referenced NREL research that in Colorado alone, using an estimated a 71% potential fill factor for the corners of these center-pivot systems – 900 km2 – would generate roughly 56.8 gigawatt hours each year, worth $5.7M at 10¢ per kilowatt-hour, and offsetting 7% of the energy cost of irrigation.
Applying the same estimated ratios for Colorado to the entire United States, the theoretical PV area in center-pivot systems would be 21,000 km2 and 1.35 TWh/year in electricity generation – offsetting $135 million a year in farm energy costs.
The paper might have christened the term “rangevoltaic”, which the authors define as solar energy generation co-located with domestic livestock activities and associated infrastructure, notably grazing areas – so sheep mostly for now. Solar folk like sheep.
Another interesting technological analysis was in considering of “land equivalent ratio” (LER). This metric is inclusive of crop yields and electricity generation, where the equation is:
solar+agro crop yields / regular crop yield + solar+agro electricity yield / regular solar yield
When this value is greater than one, then the installation is more effective spatially than separated crop and solar energy generation for the same area. The research notes a study of the LER of a durum wheat-producing farm in Montpellier, France, that found LERs of 1.73 and 1.35. Modeling in India where solar was integrated with grapes grown on trellises showed a 15-fold increase in overall economic returns compared to conventional (no solar) farming with no reduction in grape yields. Another simulation study in North Italy revealed solar panels confer more favorable conditions for rainfed maize productivity than full light, and LERs were always >1.
And to end it, here’s a great twitter account with a lot of great agrovoltaic techno-synergestic images:
https://twitter.com/ThibaultFrisson/status/1069883925844103170
This content is protected by copyright and may not be reused. If you want to cooperate with us and would like to reuse some of our content, please contact: editors@pv-magazine.com.


Perhaps, it’s time to go backwards. There was a time in this country when the budding energy generation industry was D.C. or A.C.. For the time A.C. won out. Yet it is more efficient to use the power where it is generated, right on the roof of the home or business the solar PV product is installed. At one time Edison’s vision was D.C. generation at each home and D.C. voltages powering the homes completely. Now with solar PV and energy storage, it could be possible to once again power one’s home with D.C. instead of A.C.. There’s a lot of roof space available across the nation to put in the distributed energy resource. Bi-facial and multi layered solar PV cells could make solar PV installation less rigid as to the installation direction of panels and the number of panels needed to achieve solar PV sufficiency for daily energy needs.
Parking lots seem the best location, especially for the desert southwest.