
It’s hardly a secret that California dominates solar deployment. Not only was the state a pioneer in solar policy and put some of the nation’s first large-scale solar plants online starting in the late 1980s, but it has kept relatively steady policy support while other states have gone back and forth on their commitments. This is the likely the primary reason that California gets the highest portion of its power from in-state solar (14% in 2018) of any state, but a lot of sun doesn’t hurt either.
And as the state’s policies have supported both large-scale and distributed solar, it should not be a surprise that California cities are among the leaders in terms of installed solar, both measured on raw volume and watts per resident, as documented by Environment America in its latest report on U.S. cities and solar.
It is the latter figure which shows some of the discrepancies. While Los Angeles is the top city for total volume of solar deployed at 420 MW, this is due in part to it being the second-largest city in the United States with four million residents, and it doesn’t make the top 10 for watts per capita.
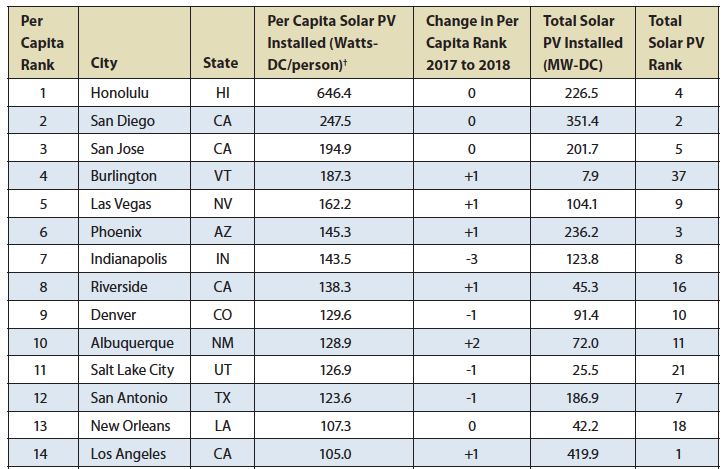
In fact, with only 105 watts per resident, Los Angeles is well behind San Diego (#2 at 247 watts per capita), San Jose (#3 at 195 watts per capita) and Riverside (#8 at 138 watts per capita).
LADWP
San Diego, San Jose and Riverside are notable as they are some of the largest cities in the service areas of California’s three investor-owned utilities: respectively, San Diego Gas & Electric Company (SDG&E), Pacific Gas & Electric Company (PG&E) and Southern California Edison (SCE). Whereas Los Angeles has its own municipal utility, the Los Angeles Department of Water and Power (LADWP).
This may appear counterintuitive for those who read Naomi Klein’s 2014 book, This Changes Everything, which argued that taking public control of utilities was a necessary first step towards decarbonization. If this is the case, when why isn’t LADWP – a public utility under the control of the voters of Los Angeles – a leader in solar?
In a February interview with pv magazine USA, California Solar and Storage Association (CALSSA) Executive Director Bernadette Del Chiaro blamed the agency’s bureaucracy for a lack of progress. She noted that while the interconnection process has finally been streamlined for residential solar, that there are now significant difficulties getting behind-the-meter energy storage systems interconnected.
“I can’t tell you how many contractors refuse to do business in Los Angeles because of the bureaucracy,” Del Chiaro told pv magazine.
LADWP may have turned a corner, as the city rose one place in the per-capita rankings this year, but its position is still unimpressive for a city in California.
Across the nation
Honolulu kept its first place rank for per capita solar, with 646 watts per resident. This is unsurprising, as with very high retail power prices Hawaii has a wide lead as the top state for deployment of rooftop solar.
But moving down the list are some cities that may come as surprises. Burlington, Vermont came in fourth-place for per-capita solar, as the top city on the East Coast. Vermont passed a 75% by 2032 renewable energy mandate in 2015, which is arguably more ambitious than any state. While it is not a 100% target like California, Hawaii or New Mexico have, the date is more aggressive. In this it is only exceeded by Washington DC’s 100% by 2032 – the strongest in the nation.
And while Indianapolis fell three spots on the per-capita ranking, Las Vegas and Phoenix both climbed. Due to its large size, Phoenix also has the third-highest total installed volume of solar at 236 MW.
In Arizona, it can’t really be said that this is due to policy, as net metering has been weakened by regulators allowing utilities to impose discriminatory charges. Instead it may simply be a case of raw economics and plentiful sunshine, coupled with a strong desire by consumers to gain a degree of independence from their utility.
Denver and Albuquerque round out the top 10 in terms of per-capita rankings, followed by Salt Lake City and San Antonio. #13 may surprise many: New Orleans. Despite being an oil and gas state and demonstrating its infamously crooked politics, Louisiana for years had a generous 50% state tax credit for behind-the-meter solar.
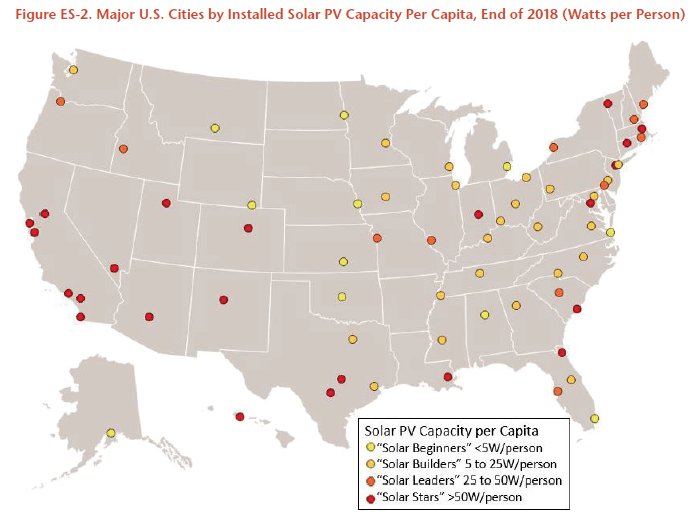
Environment America’s 2019 Shining Cities report surveyed 69 U.S. cities, including the largest cities in the top 50 metro areas and the largest city in a given state for those that do not have a top 50 metro area.
This content is protected by copyright and may not be reused. If you want to cooperate with us and would like to reuse some of our content, please contact: editors@pv-magazine.com.


how many solar systems were installed in 2020 by LADWP and a breakdown for business and residence. first two quarters of 2020……