
The solar industry has coined a phrase that sums up the great swings between expansion and contraction of markets, accompanied by price collapses and stabilizations, that characterizes the U.S. market: the solar coaster. However, the largely unpredictable swings from quarter to quarter amid an overall trend of exponential growth is not only true of solar, but of the energy storage market as well.
In many ways, the second 2017 was the downswing on this trend, as shown in GTM Research and the Energy Storage Association’s Q3 Energy Storage Monitor. The report finds that U.S. energy storage deployments in capacity terms fell to only 38 MW during Q2, after two quarters above 70 MW. Even in year-over-year terms this is a decline of 11%.
When measured by energy, or megawatt-hour (MWh) the picture is similar. The 50.4 MWh of energy storage put online in the nation is a 78% fall from the previous quarter, but a 6% increase year-over year.
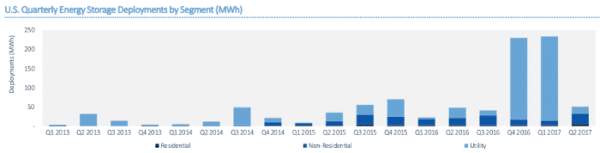
The biggest reason for the sequential decline is that systems procured to make up for lost flexible capacity due to the Aliso Canyon Gas Leak came online during the previous two quarters, meaning that Q2 is mostly just a return to normal deployment.
However, it also shows that as time goes on the industry is moving to longer-duration batteries, as deployment moves from systems designed to provide short-term frequency regulation in the PJM Interconnection, to longer-duration systems that can provide peak shifting in states like California and Hawaii.
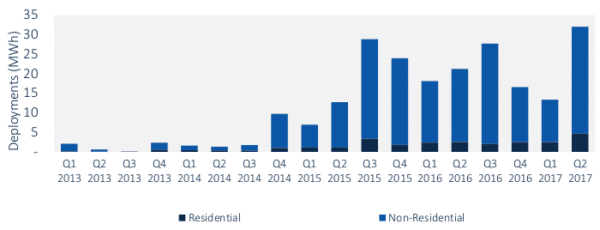
However, there are several other important trends that emerged the report. Q2 2017 is the first time in nine months that the behind-the-meter market was bigger than the utility-scale market. In fact, behind-the-meter battery storage had its best quarter ever, with 32 MWh of energy storage deployed, mostly in the commercial and industrial (C&I) sector (which the report calls “non-residential” to include non-profit, government and other installations).
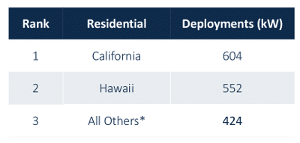
And while California continues to lead in both the residential and C&I sectors, Hawaii’s residential solar market is growing quickly. During the quarter Hawaii installed 552 kW of residential energy storage, within striking distance of California’s 604 kW. GTM Research and ESA attribute this to Hawaii’s Customer Self-Supply program, a net metering successor program which mandates energy storage and which drove 71% of Hawaii’s residential storage market during Q2.
GTM Research
And while lithium-ion batteries have dominated the U.S. energy storage market for years, Q2 saw 2.0 MW of vanadium-redox flow batteries deployed, representing 5% of the market. This is the second quarter of notable vanadium redox-flow deployment, and GTM Research cites the technology’s claim to lower degradation rates as a factor in some customers choosing to experiment with the technology.
However, GTM Research also says that it expects lithium-ion technology to represent the vast majority of grid-tied battery deployments for at least the next few years.
The stationary battery storage market is smaller than the electric vehicle market, meaning that residential lithium-ion batteries like Tesla’s Powerwall are benefitting from economies of scale and R&D investments made for EV batteries. As the market for EVs continues to grow, stationary lithium-ion batteries are likely to remain beneficiaries.
“From there it just comes down to cost,” notes GTM Research Senior Analyst – Energy Storage Daniel Finn-Foley. He also notes that as lithium-ion battery makers are beginning to offer 20-year performance warranties, that this makes higher-priced flow batteries a harder sell.
This content is protected by copyright and may not be reused. If you want to cooperate with us and would like to reuse some of our content, please contact: editors@pv-magazine.com.


By submitting this form you agree to pv magazine using your data for the purposes of publishing your comment.
Your personal data will only be disclosed or otherwise transmitted to third parties for the purposes of spam filtering or if this is necessary for technical maintenance of the website. Any other transfer to third parties will not take place unless this is justified on the basis of applicable data protection regulations or if pv magazine is legally obliged to do so.
You may revoke this consent at any time with effect for the future, in which case your personal data will be deleted immediately. Otherwise, your data will be deleted if pv magazine has processed your request or the purpose of data storage is fulfilled.
Further information on data privacy can be found in our Data Protection Policy.