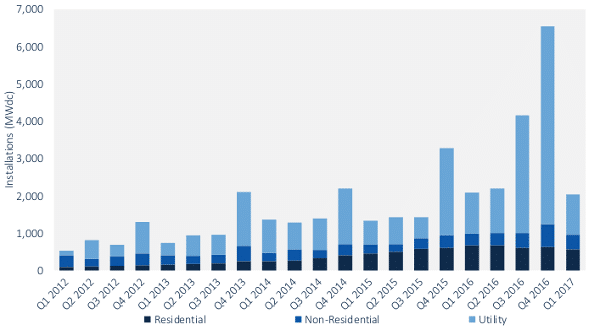
In many ways, the first quarter of 2017 was another win in a row of victories for the U.S. solar market. For the sixth straight quarter, more than 2 GW-DC of solar PV was installed, including more than 1 GW of utility-scale solar, which is roughly online with last year’s numbers. Commercial, industrial, non-profit and government installations also grew 29% year over year to 399 MW.
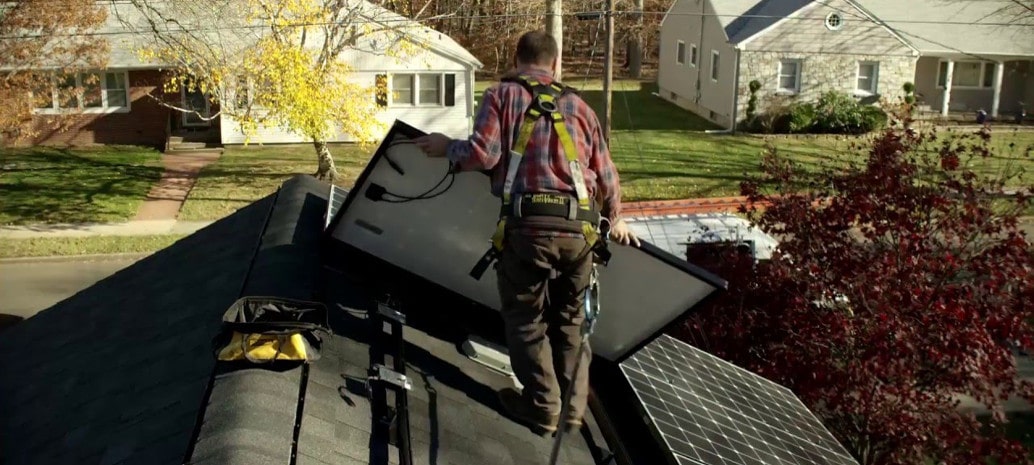
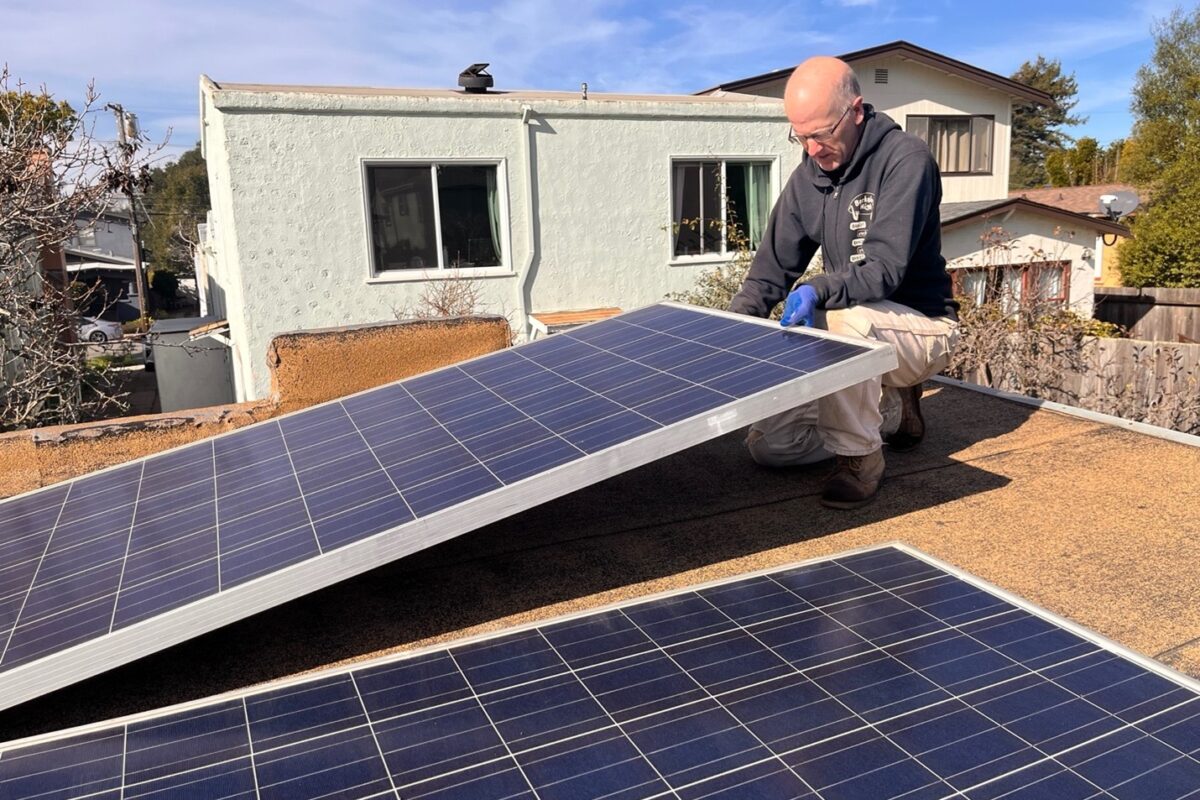
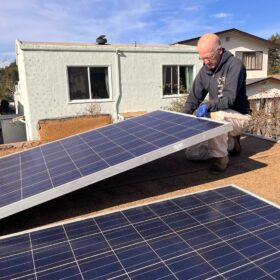
However, the U.S. residential market is in trouble, and this doesn’t look likely to change any time soon. While residential installations have typically climbed quarter-over-quarter and year-over-year, during the first quarter of 2017 the market declined both over the previous quarter and a year prior.
 This fall was largely due to a decline in California’s residential market, which has been covered in detail by pv magazine. Analysts, advocates and market participants cite multiple factors in this decline, including torrential rains, increased difficulties in customer acquisition and pull-back from Tesla and Vivint Solar, as well as the switch to Net Metering 2.0. For the final factor, it remains to be seen how much of this is the short-term affects of adjustment to the new policy and how much is the longer-term affects of delayed payback times.
However, GTM Research and SEIA note that other major state markets like Massachusetts, New York and Maryland are also facing difficulties due to issues with customer acquisition and reduced market ambition by Tesla and Vivint.
The quarter also saw a reshuffling of the top PV markets. After being outpaced by Utah and Georgia in 2016, during the first quarter North Carolina returned to its #2 spot, with 200 MW installed. Arizona, which has been on the decline for years, came back to #3 with 168 MW. Minnesota also jumped 10 places in the rankings to #4, largely due to a big volume of community solar coming online, and Idaho has come out of nowhere to represent the 5th-largest solar market.
Much of this reshuffling of top states is due to the timing of project completion in the utility-scale segment. A large number of projects have “spilled over” from 2016, after the extension of the federal Investment Tax Credit removed a hard deadline at the end of December.
And as is expected for the rest of the year, large solar projects with power contracts secured under the Public Utilities Regulatory Policy Act of 1978 (PURPA) represented the largest source of new utility-scale capacity. However, such markets are also subject to policy risk. Idaho is not likely to remain the 5th-largest national solar market for long, given that the state has slashed PURPA contract lengths.
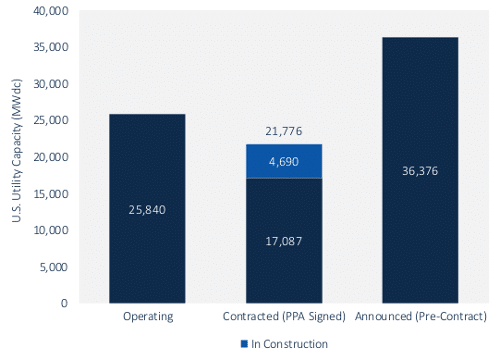 Despite this, the future looks bright for the utility-scale segment. The report notes that 4.7 GW of utility-scale projects are currently under construction, and another 17 GW hold signed power purchase agreements. But the best may be yet to come.
“Utility solar is on the cusp of another boom in procurement,” said GTM Research Associate Director of U.S. Solar Cory Honeyman. “The majority of utility solicitations are focused on maximizing the number of projects that can come online with a 30 percent federal Investment Tax Credit in 2019, or later by leveraging commence construction rules.”
This content is protected by copyright and may not be reused. If you want to cooperate with us and would like to reuse some of our content, please contact: editors@pv-magazine.com.


About the SoCal market. I signed my contract on 4/22, and am still waiting for SDG&E as of 6/8 to do their preliminary inspection. They claim to be extremely backed up due to the high volume of new solar installations.