The United States energy storage market installed 18.9 GW and 51 GWh of capacity in 2025, according to the quarterly Energy Storage Monitor report from Wood Mackenzie. This volume represents a 52% increase in installations compared to 2024 levels.
The final quarter of the year set a record for quarterly activity with 5.8 GW and 14.8 GWh deployed across all segments. Since 2019, the nation has installed over 50 GW and 144 GWh of storage capacity.
Market growth continues to result from declining system costs, federal policies, and revenue opportunities. Average annual installations have grown 107% on a MWh basis over the last six years.
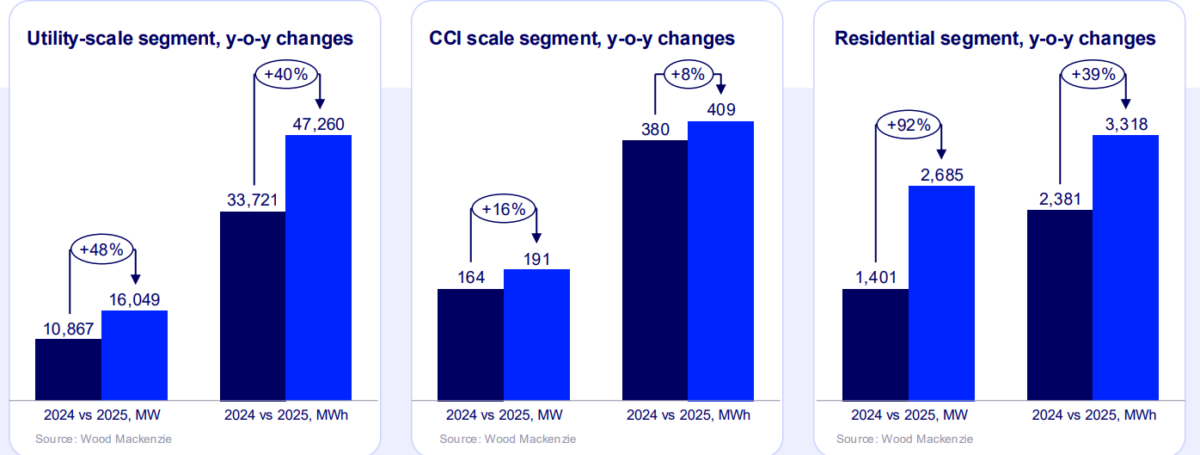
Segment performance varied in 2025, with utility-scale storage providing the majority of capacity while the residential sector experienced the highest percentage of year-over-year growth.
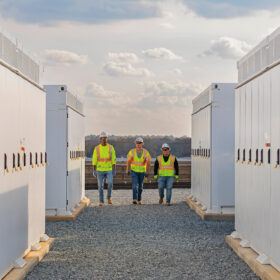
Utility-scale storage installations reached 16 GW for the full year. In the fourth quarter, this segment deployed 4.9 GW. Growth in this sector occurred in 22 states during the year and 13 states during the fourth quarter. The geographic distribution indicates diversification beyond the markets of California and Texas.
Drivers for utility-scale deployment include tax credits, system costs, and offtake agreements with utilities. The utility-scale pipeline includes 152 GW of projects in databases and 530 GW of projects in interconnection queues as of the fourth quarter of 2025.
The residential segment installed 2.7 GW in 2025. This total represents a 92% increase from 2024 capacity. In the fourth quarter, residential storage crossed the 1 GWh threshold for the first time.
Demand in this segment resulted from the expiration of the Section 25D Investment Tax Credit (ITC) at the end of the year. California remained the market leader for residential storage, installing 700 MW more than in the previous year. Puerto Rico, Texas, Arizona, and Illinois followed as top markets for growth.
The community-scale, commercial, and industrial (CCI) segment installed 95.6 MW in 2025. This volume is a 16% increase from 2024.
During the fourth quarter, the segment reached 77 MW of installations. Policy at the state level supported growth in community storage opportunities. California led the segment with 45 MW of installations in the fourth quarter. New Mexico also recorded 5.9 MW of installations during the same period.
Forecasters expect the United States to add 500 GWh of storage capacity between 2026 and 2031. This volume would represent a 250% increase compared to the period from 2020 to 2025.
Utility-scale storage is projected to grow at an average rate of 16% per year. Growth is expected to be supported by federal incentives, load growth, and demand for peak power. The transition to domestic cell manufacturing is also expected to support the segment over the next five years.
The CCI segment is projected to grow 39% from 2025 to 2030. While a dip in installations is expected in 2026 due to project shifts in Illinois, growth is anticipated to continue due to system costs and tax credit access. California, Massachusetts, and New York are expected to remain the markets that anchor this segment.
Residential storage is forecasted to contract by 2% in 2026 following the expiration of the ITC. This projection is an update from a previous forecast of a 6% contraction. The revision results from interconnection backlogs and momentum in third-party ownership models.
High-deployment and low-deployment market scenarios for the period through 2031 include a range of 52 GW in possible installations. This range results from uncertainty regarding load growth, trade policy, and guidance on Foreign Entities of Concern (FEOC).
A high-case scenario suggests 28 GW of upside if FEOC guidance is workable for the industry and trade barriers ease. A low-case scenario suggests 17% less capacity than the base case if stricter guidance and development barriers slow progress.
Specific assumptions for these scenarios involve tax credit availability, supply chain constraints, and interest rates. The base case assumes the Federal Reserve will implement three interest rate cuts in 2026, with rates remaining between 2.5% and 3.5% through 2030. Demand forecasts for large-load buildout also vary across the scenarios.
This content is protected by copyright and may not be reused. If you want to cooperate with us and would like to reuse some of our content, please contact: editors@pv-magazine.com.


By submitting this form you agree to pv magazine using your data for the purposes of publishing your comment.
Your personal data will only be disclosed or otherwise transmitted to third parties for the purposes of spam filtering or if this is necessary for technical maintenance of the website. Any other transfer to third parties will not take place unless this is justified on the basis of applicable data protection regulations or if pv magazine is legally obliged to do so.
You may revoke this consent at any time with effect for the future, in which case your personal data will be deleted immediately. Otherwise, your data will be deleted if pv magazine has processed your request or the purpose of data storage is fulfilled.
Further information on data privacy can be found in our Data Protection Policy.