Solar continues to lead the way for the United States in its efforts to expand electric generation capacity. According to the Federal Energy Regulatory Commission (FERC), 16 GW of solar was added through July in 2025, accounting for nearly 75% of the 21.5 GW of electric generation capacity added overall.
Grid Strategies LLC forecast that electricity demand will increase 16% in the next five years after remaining relatively flat for several years, suggesting the growth path ahead for solar continues to expand.
Through July, FERC reported that wind was the second-largest source of new capacity, adding 3.2 GW, followed by natural gas with 2.2 GW. Natural gas added nearly twice as much capacity through July in 2025 as compared to the same period in 2024.
Solar is outpacing itself year-over-year slightly, with 15.7 GW added through July in 2024 compared to just over 16 GW this year.
In the overall energy mix, natural gas remains the leading source of electricity by a large measure. Standing at 42% of the energy mix, FERC reports 567 GW of natural gas is active on the U.S. grid. Coal is next with 198 GW (14.8%), then wind with 158 GW (11.81%) and solar with 153 GW (11.42%).
Based on current deployment rates, it is likely that solar will surpass wind as the third-largest source of electricity. And solar may soon topple coal in the number two spot.
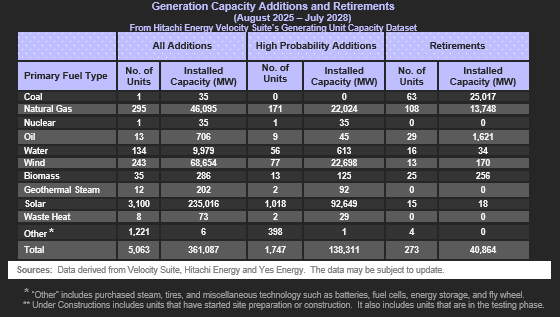
Looking ahead, through July 2028, FERC expects no new coal capacity to come online based on its “high probability additions” forecast. Meanwhile 63 coal plants are expected to be retired, subtracting 25 GW from the 198 GW total, and landing at about 173 GW of coal capacity by 2028. Meanwhile, FERC forecasts 92.6 GW of “high probability additions” solar will come online through July 2028.
This would place solar at an installed capacity of about 250 GW – exceeding coal’s 173 GW by 44%.
In July alone, solar developers brought online 46 large-scale projects totaling 1,181 MW of new electric generation capacity. Project activations July 2025:
- 249RD 8 ME LLC’s 202.8 MW Estonian Solar & Storage Expansion Project in Delta County, TX
- Capital Dynamics’ 200.0 MW Eland Solar Farm in Kern County, CA
- Apex Clean Energy Inc’s 150.0 MW Coldwater River Solar Project in Branch County, MI
- Northern Orchard Solar PV LLC’s 150.0 MW Northern Orchard Solar PV Project in Kern County, CA
- Duke Energy Florida’s 74.9 MW solar Sundance Renewable Energy Center in Madison County, FL
- Liberty 1 Solar LLC’s 60.4 MW XE Murat Solar & Storage Project in Harris County, TX
- Avangrid Renewables LLC’s 60.0 MW Bakeoven Solar LLC Expansion in Wasco County, OR
- Ho Ohana Solar I LLC’s 52.0 MW Ho Ohana Solar 1 Project in Honolulu County, HI
- SloughHouse Solar LLC’s 50.0 MW SloughHouse Solar Project in Sacramento County, CA
- Flint Hills Resources LP’s 27.0 MW solar Koch Corpus Refinery Expansion in Nueces County, TX
- Cypress Creek Renewables LLC’s 20.0 MW Cardinal Solar (PA) Project in Venango County, PA
- WS Sarish LLC’s 20.0 MW solar Smith Francis Junction Project in Washington County, PA
- NJR Clean Energy Ventures Corp’s 15.4 MW Parker Road Solar Project in Morris County, NJ
- Biggs Ford Solar Center LLC’s 15.0 MW Biggs Ford Solar Project in Frederick County, MD
- County Highway Solar 2 LLC’s 5.0 MW Couty Highway Solar 2 Project in Fulton County, NY
- Nautilus Solar Solutions LLC’s 5.0 MW solar North Woods Project in Saint Lawrence County, NY
- NY CDG Montgomery 1 LLC’s 5.0 MW solar NY Fonda 182 Boshart Rd Montgomery 1 Project in Montgomery County, NY
- St Clair Solar 5 LLC’s 5.0 MW St Clair Solar 5 Project in Saint Clair County, IL. The power generated is sold to Ameren Corp under long-term contract.
- St Lawrence County NY S2 LLC’s 5.0 MW solar St Lawrence County NY S2 Project in Saint Lawrence County, NY
This content is protected by copyright and may not be reused. If you want to cooperate with us and would like to reuse some of our content, please contact: editors@pv-magazine.com.


This is “Before the meter” solar and does not count homeowner’s or businesses NEM qualified rooftop solar systems. Sources online say there are, as of 2024, over 50 gigawatts of U.S. rooftop solar systems installed on homes and commercial buildings. Each watt produces one kilowatt hour of power over the period of one year on average. That would mean 50 Giga-kilowatt hours that cannot be counted by utilities since homeowners and businesses use most of it up in their homes. Solar is already ahead of Coal, Wind and catching up to hydro power when commercial and residential NEM Rooftop Solar is added to the equation. Utilities are worried and cutting back on NEM compensation like they did in California with NEM 3.0.
Installed GW of solar…
However, there’s no math for the capacity factors.
Solar works only about 20% of the time, whereas the others generate for a higher % of the time.
So, if we have 1TW of solar compared to, say 0.3 TW of nuclear, and if the solar CF is 20% and the nuclear, 90%, we can figure as follows:
2/10ths of 1 TW is 0.2 TW, continuously, and 9/10ths of 0.3 TW is 0.27 TW continuously, averaged out.
This would be about 27/20 more power from the hypothetical (and mass produced molten salt or other BETTER than today’s) nuclear. I believe it’s about the same for the fossil fuels, 90%.
The same ratio should apply for TWh (multiplying the power for 8,760 hours in a year).
That said, if the WEST could make its own PV and Na-ion (or LFP if the newer stuff doesn’t pan out) then we should be able to overcome that 20% or so CF by making 4x of the stuff and the (two sets of) batteries cheaper than 30 years of fossil fuels.
I mean, paying for fossil fuels for 30 years has GOT to be expensive! 😁
Installed capacity is not the way to compare generation types. Yearly energy generation by type provides a more accurate picture.
I wanted to post this on FB This is wonderuful news to give people hope
It’s great news that the clean energy capacity will surpass traditional energy, no matter what. Initiated with the municipal project using solar or wind energy, then the household solar or wind usage popularization. Get rid of the coal capacity by year-on-year reduction.