Over the past year, solar generation surpassed natural gas to become California’s leading source of electricity, a milestone expected to persist.
Data from the U.S. Energy Information Administration (EIA), processed by Ember’s US Electricity Data Explorer, shows that in the 12 months ending April 2025, solar generated 83.1 terawatt-hours (TWh) of electricity, compared to 81.6 TWh from natural gas.
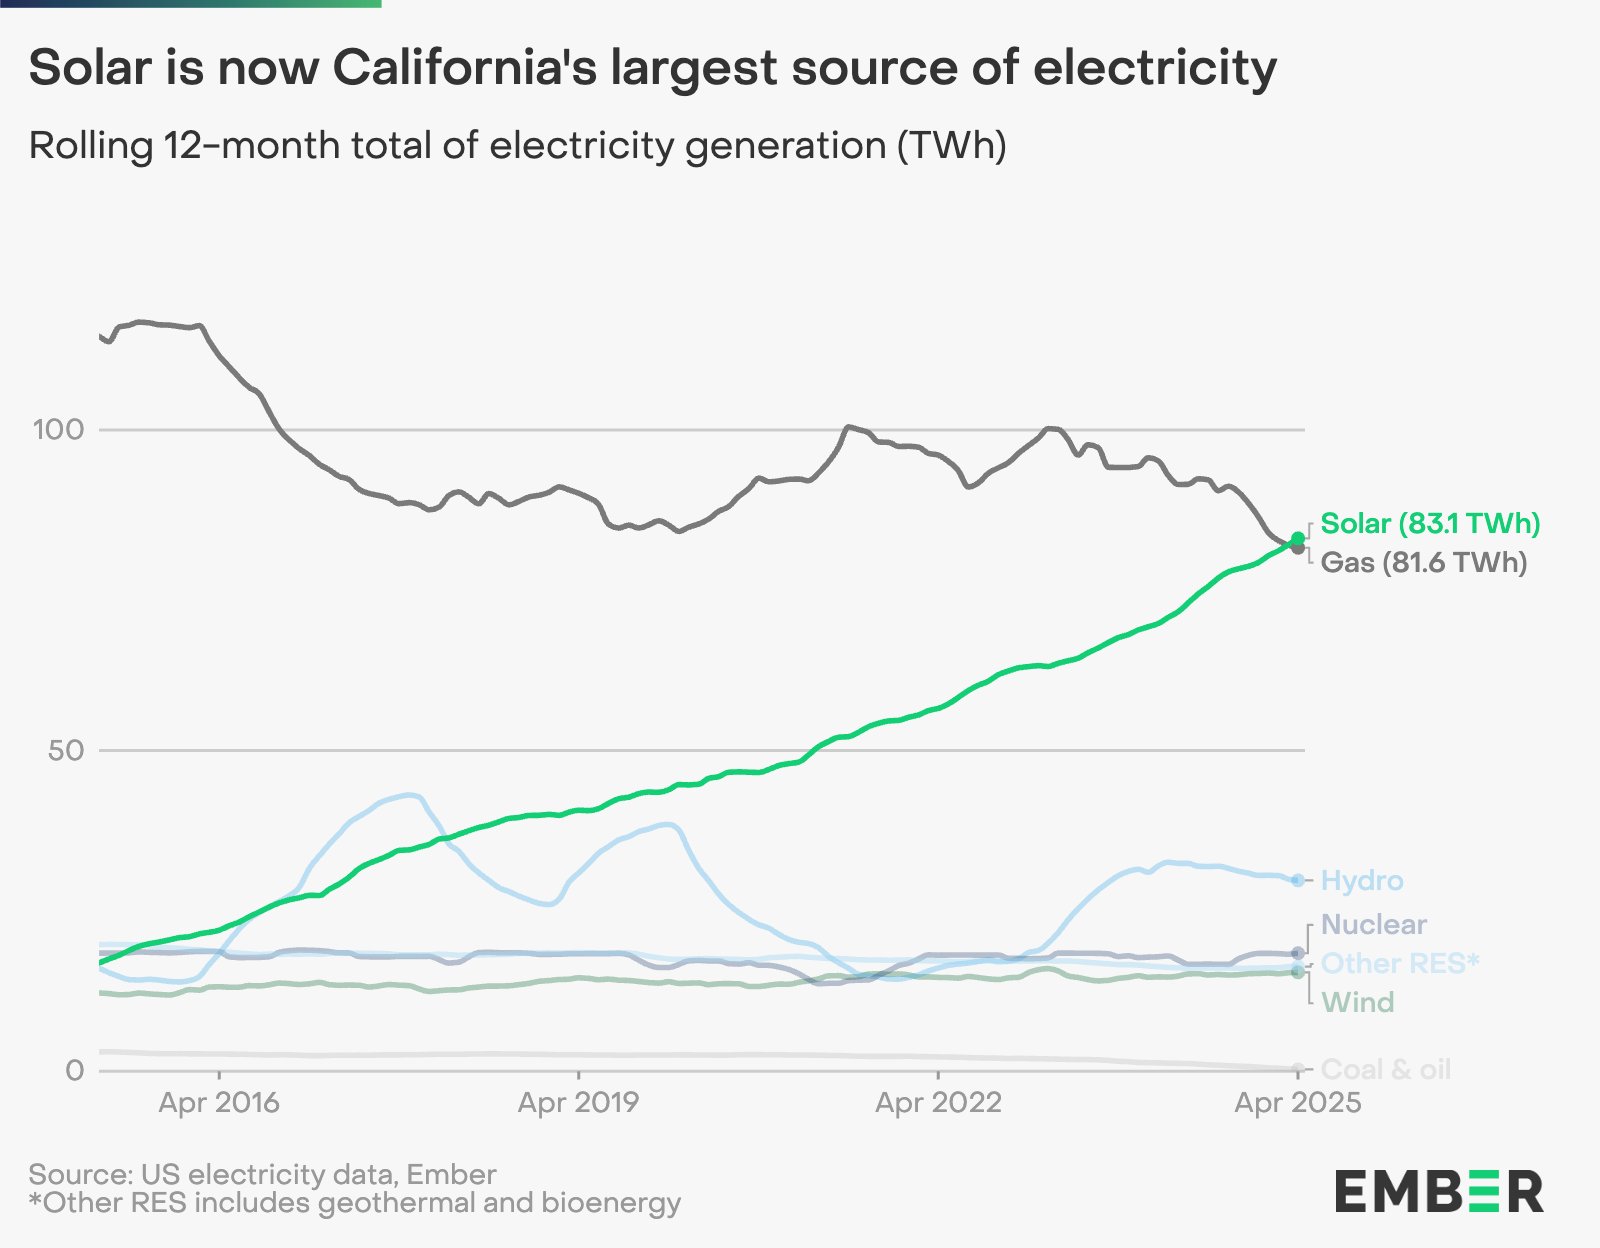
During that period, California generated a total of 244.9 TWh, with solar accounting for 33.9% of the state’s electricity and gas contributing 33.3%.
Natural gas accounts for nearly all fossil fuel use in California’s power generation, with just 0.1% of the state’s electricity coming from coal and 0.02% from other fossil sources. In total, about two-thirds of the state’s electricity now comes from emissions-free sources.
The shift in rankings between solar and gas is primarily due to the sharp increase in solar generation, though natural gas has also declined as a share of the mix.
From 2014, when the EIA began tracking distributed solar, through the end of 2024, solar grew from 7% of California’s electricity to more than 32%. Over the same period, natural gas fell from nearly 59% to 35% in 2024, and to 33.3% over the most recent 12 months.
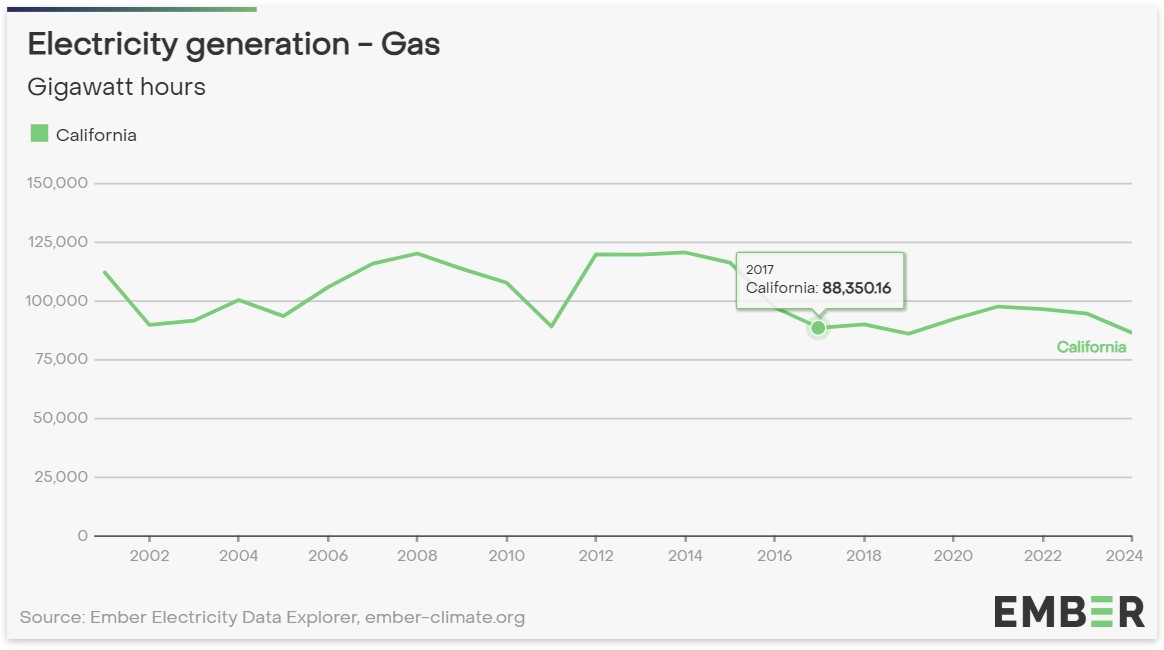
Yet the total amount of gas burned has declined only slightly and has essentially stagnated since 2017. Gas generation peaked at just over 88 TWh in 2017, falling to about 86 TWh in 2024. This represents a decrease of just 2.3% over nearly a decade, based on a slightly cherry-picked comparison.
More recently, however, the rate of decline has accelerated, likely driven by battery capacity deployments combined with additional solar. This has enabled greater solar utilization, particularly during the gas-dominated evening peaking periods. Comparing the first four months of 2024 to the same period in 2023, gas generation fell more than 18% and is down 12% compared to the same period in 2017.
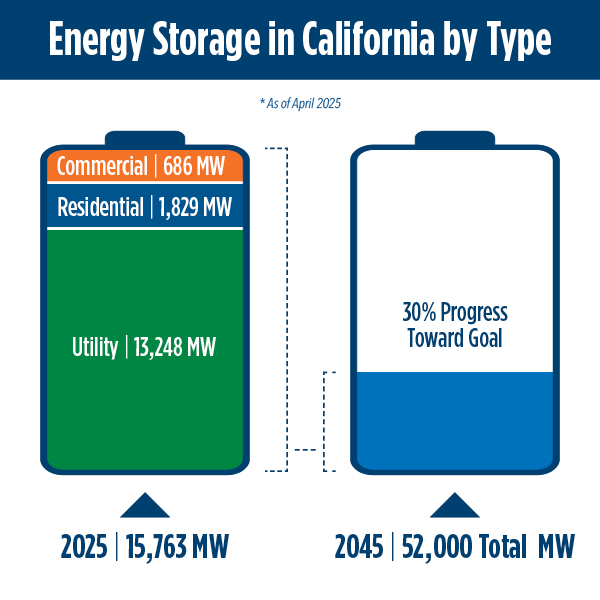
California’s battery fleet now plays a central role in shifting solar power into the evening. As of April 2025, the state had installed more than 15.7 GW of battery capacity, briefly becoming the grid’s largest electricity source during evening peaks. Storage has doubled roughly every 1.2 years, now exceeding 10 GW of output and about 40 GWh of total energy.
Nationally, solar generation continues to climb. In April, solar supplied 10.64% of U.S. electricity for the month (marking the first time the country crossed the 10% mark) and contributed 7.35% of generation over the rolling 12 months. California, by comparison, produced 42% of its electricity from solar at its seasonal peak in April, with May expected to push that figure even higher.
This content is protected by copyright and may not be reused. If you want to cooperate with us and would like to reuse some of our content, please contact: editors@pv-magazine.com.


nice now that solar being cheaper when are the electric bills going to go down.
Unfortunately NEVER…PG&E in my region is a publicly traded company and the only thing that really matters to them is shareholder value which does not go up if prices go down…😳
Short answer, corporate greed, get your own PV array if you want it to be cheaper
Why isn’t California building more wind? Wind pairs very well with solar as their peaks are often complementary.
Hahahahahaha, free electricity for most of the daylight hours along with the nation’s highest electric rates makes perfect sense in California…
So what! That solar power is available for about 6 hours each day. Then it has to be replaced by something dependable and dispatchable. I get so sick of this charade! Solar has to have a backup, and this dual infrastructure is part of the reason why California has some of the most expensive electricity rates in the nation. And practical backup is years out.
Sooooo, Solar works now at night.. Amazing