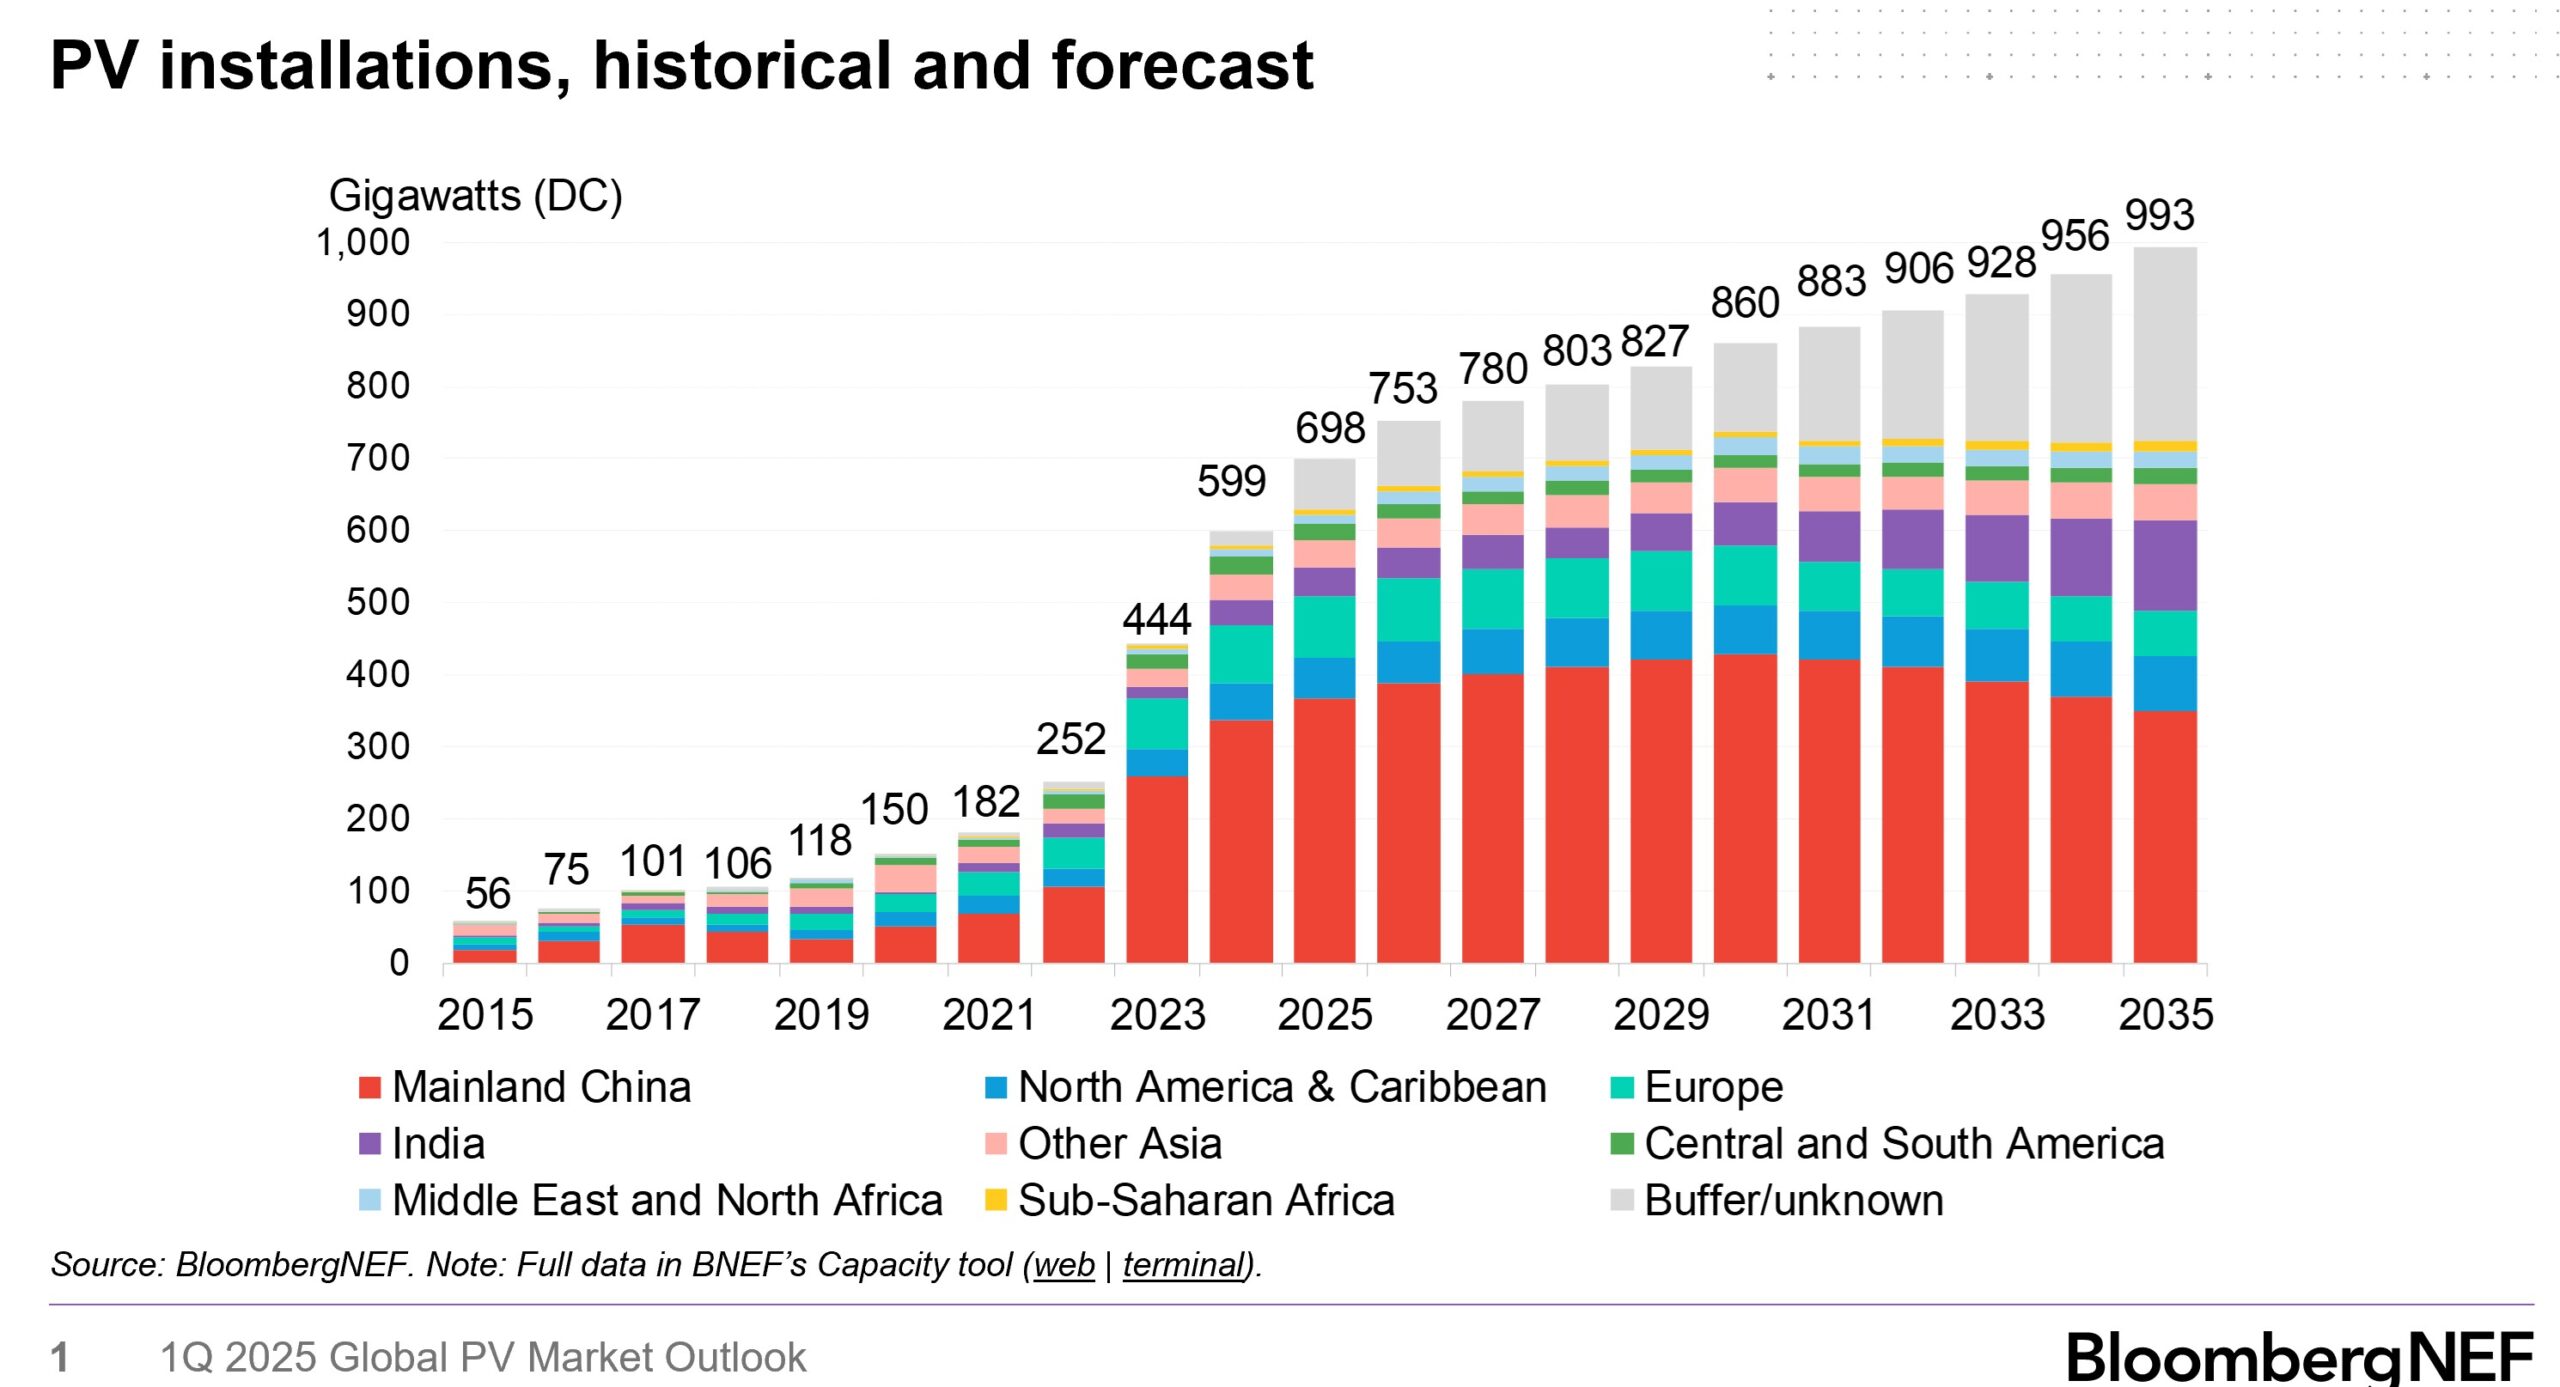
BloombergNEF said the world installed 599 gigawatts (GW) of solar power in 2024 and projects 698 GW in 2025. The 599 GW installed in 2024 was 35% higher than what was installed in 2023, which itself jumped by 77% over 2022’s deployment.
The 2025 projection of 698 GW represents a more modest 16% growth rate. If that figure holds, it would mark the lowest global growth rate since 2018 and 2019, when deployments rose by 5% and 11%, respectively, according to BloombergNEF data.
However, BloombergNEF’s initial projections have tended to be conservative, while the solar industry has repeatedly outpaced most growth forecasts. This raises the question: What will 2025’s final deployment figure look like, and will it be enough to keep us on track for 1 terawatt (TW) per year?
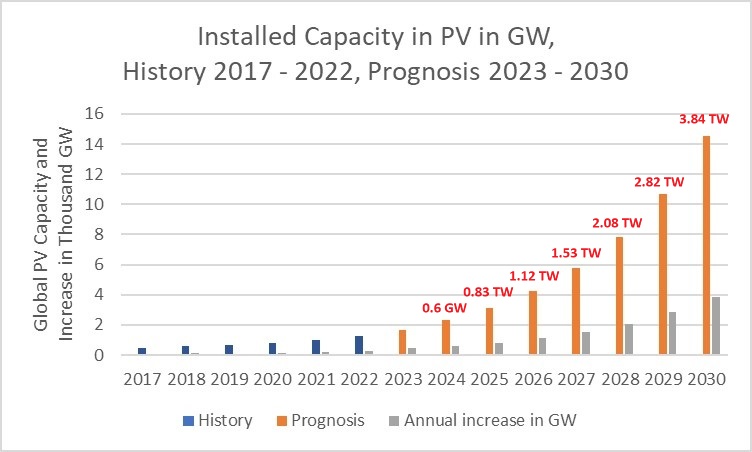
First, what is the 1 TW annual pace? Longi Solar and the DR Dahlmeier Financial Risk Management group have each offered recent projections. Longi Solar anticipates the world will surpass 1 TW capacity deployed in a single year by 2030, noting that installed capacity has historically doubled about every three years, leading to more than 1 TW annually by the end of the decade.
More recently, the Dahlmeier team proposed a far more aggressive timeline: 1 TW of solar by 2026! (See chart below.) These two targets contrast with BloombergNEF’s chart (above), their moderate growth projection, which suggests the world may not reach the 1 TW-per-year mark by 2035. The analyst’s ‘optimistic’ growth projection does suggest 1 TW early in the 2030s.
Meanwhile, the International Energy Agency (IEA) says the world “only” needs 615 GW of solar annually to meet 1.5°C goals by 2050, prompting some, including some at Bloomberg NEF, to ask why 1 TW per year is even relevant beyond its appeal to enthusiastic technogeeks.
Regardless of long-term goals, this year we will already surpass the IEA’s 615 GW-a-year by 2050 figure. If BloombergNEF’s history of conservative projections holds, the industry may also exceed the 698 GW forecast. By how much remains to be seen, and observers wonder whether the final tally could approach Dahlmeier’s 830 GW projection.
It is well known that official bodies have historically underestimated the solar industry’s pace of growth. The IEA in particular has been criticized for missing the mark in its forecasts, and even BloombergNEF, generally regarded as a leading solar market analyst, has occasionally underprojected solar’s momentum.
In her book, BloombergNEF analyst Jenny Chase shares a chart illustrating how much the group’s forecasts have underestimated real-world deployments. At the request of pv magazine USA, she provided data that helped produce the following graph.
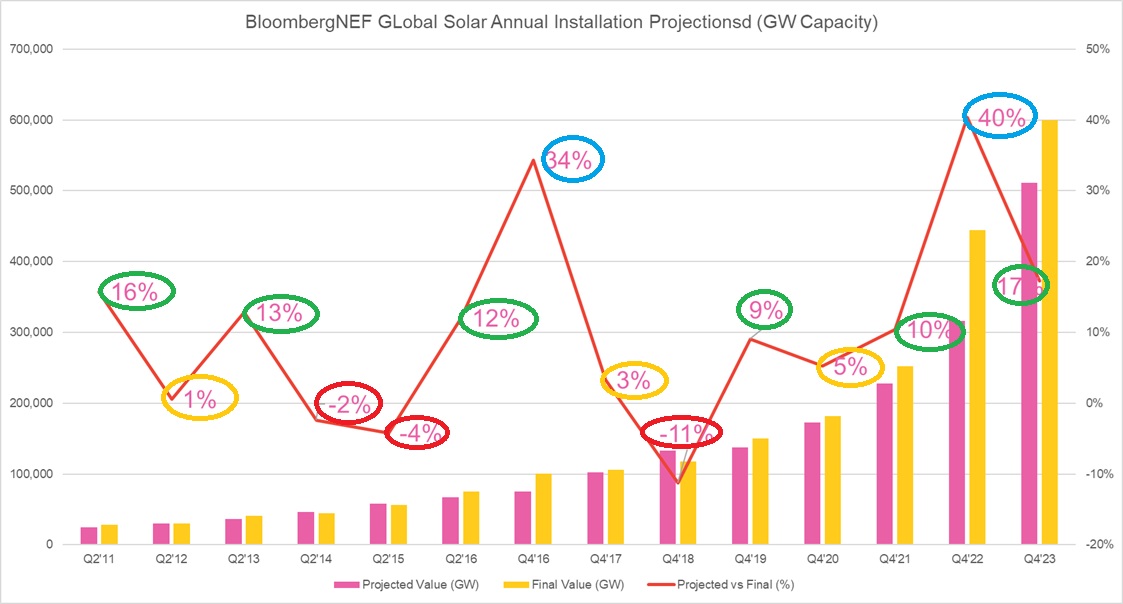
The pink bars show BloombergNEF’s projections from the prior year, while the yellow bars reflect actual installations. The red line indicates how much the group’s estimates missed the mark, which was predominantly an underestimation except for three years (in red) when BloombergNEF overshot growth.
Since BloombergNEF’s 2011 forecast, it has, on average, underestimated final deployment volumes by about 10%. Since 2019, the shortfall has averaged 15%. Applying those percentages to the Q4 2024 forecast of 662 GW, which BloombergNEF has already revised upward to 698 GW as of Q1 2025, suggests that actual deployment could land between 729 and 761 GW.
Meanwhile, BloombergNEF’s current “optimistic” projection for 2025 is 745 GW, equivalent to 25% growth over 2024’s 599 GW.
However, reaching 1000 GW from the optimistic 745 GW requires an additional 34% growth, which may not be too far-fetched. Though, the absolute volume needed—255 GW—is roughly what was installed in 2021, a year still considered an impressive growth milestone.
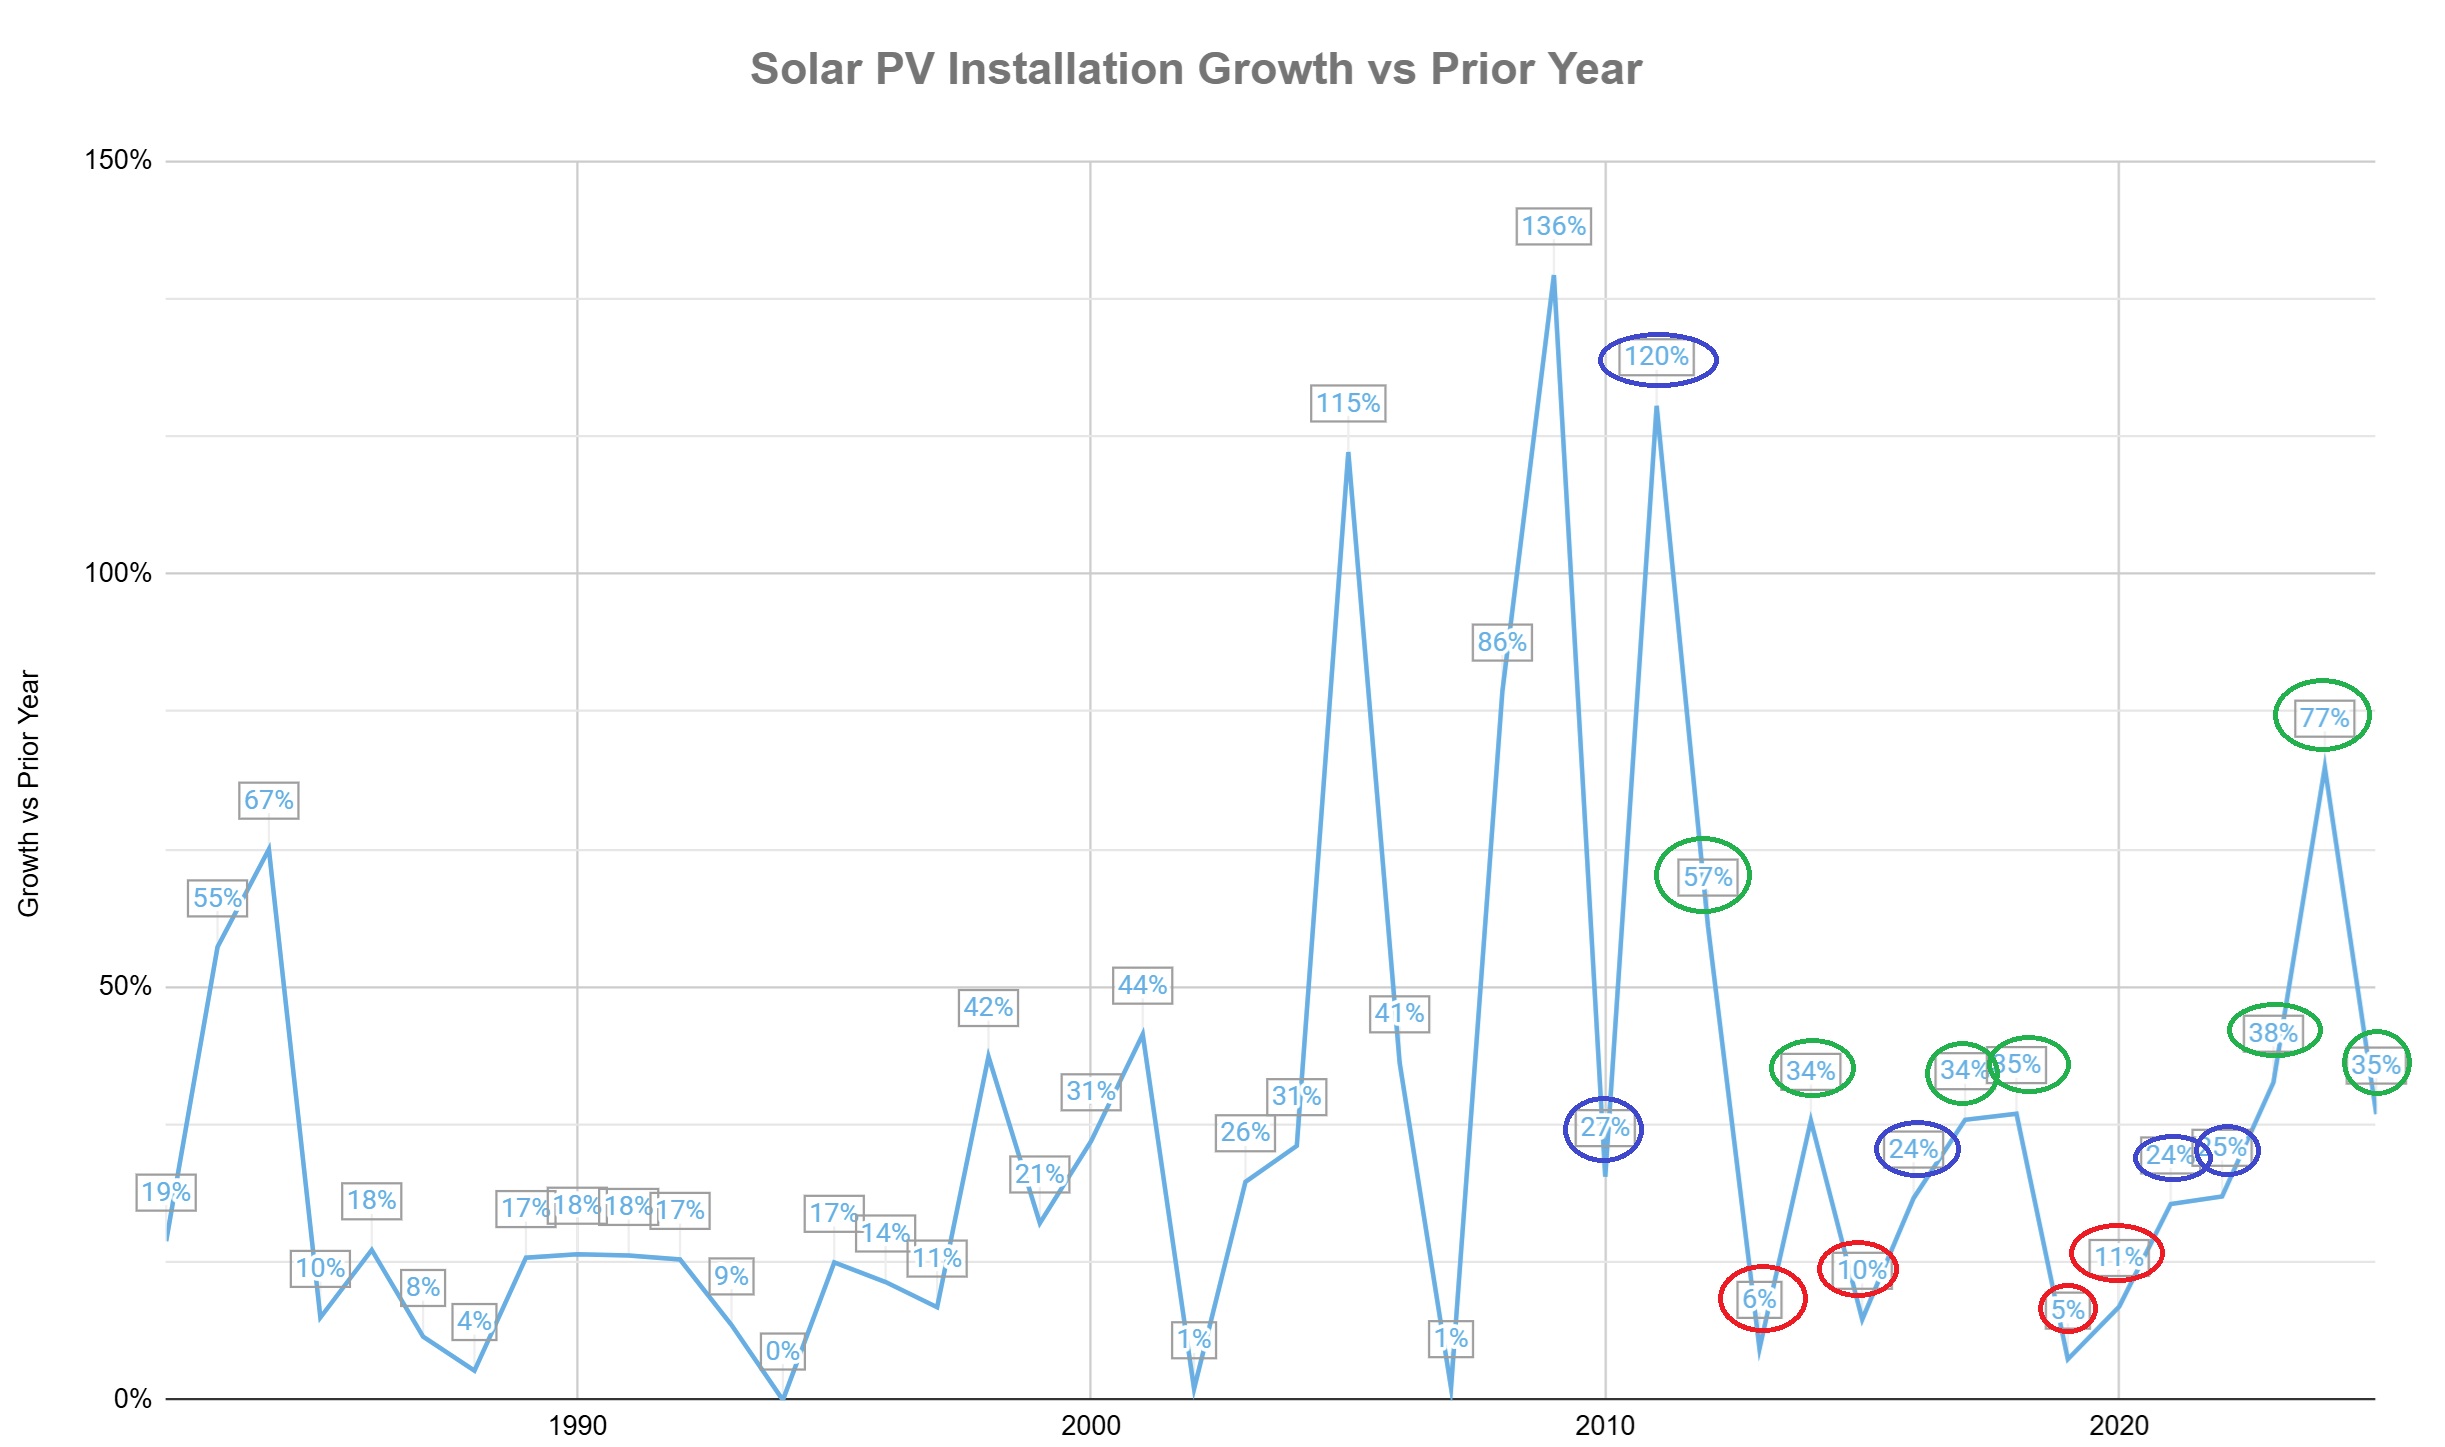
Since 2010, the solar industry has hit growth rates of 34% or higher in eight different years. Four other years saw upper-20% growth, and four years were in the 5% to 11% range. Over that period, the industry’s compound annual growth rate has averaged 36%.
With all of these figures in mind, consider 2024’s 599 GW deployment. Two consecutive years of 30% growth (599 GW → 778 GW → 1,012 GW) would land just over 1 TW in 2026. This leads us to wonder whether 2025 and 2026 can maintain historical growth rates. If they do, the global solar industry will deploy just over 1 TW of solar power in 2026, which is next year.
This content is protected by copyright and may not be reused. If you want to cooperate with us and would like to reuse some of our content, please contact: editors@pv-magazine.com.


By submitting this form you agree to pv magazine using your data for the purposes of publishing your comment.
Your personal data will only be disclosed or otherwise transmitted to third parties for the purposes of spam filtering or if this is necessary for technical maintenance of the website. Any other transfer to third parties will not take place unless this is justified on the basis of applicable data protection regulations or if pv magazine is legally obliged to do so.
You may revoke this consent at any time with effect for the future, in which case your personal data will be deleted immediately. Otherwise, your data will be deleted if pv magazine has processed your request or the purpose of data storage is fulfilled.
Further information on data privacy can be found in our Data Protection Policy.