Of the 1100 GW of utility-scale solar waiting to interconnect to the grid at the end of 2023, 31 GW reached commercial operation during 2024, according to the Solar Energy Industries Association.
And of the 1000 GW of battery storage awaiting interconnection at year-end 2023, about 15 GW were expected to begin serving grid needs in 2024, according to S&P Global.
To explore how interconnection costs are barriers to interconnection, researchers at Lawrence Berkeley National Laboratory and the consultancy Exeter Associates analyzed interconnection cost data for generating projects, in an article “Grid connection barriers to renewable energy deployment in the United States,” published in Joule and available for free.
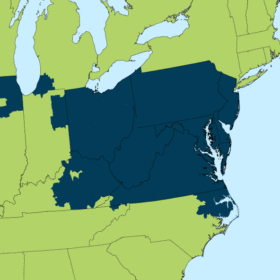
The study, based on data from six of the nation’s seven regional grid operators, also proposed solutions to make interconnection less costly and more predictable.
Network upgrade costs
For generating projects withdrawn from interconnection queues, researchers split interconnection costs identified by grid operators into local interconnection costs at the point of interconnection, and broader network upgrade costs “that become the responsibility of an individual interconnection customer but can often be located much deeper in the transmission network.”
They found that for projects withdrawn from interconnection queues, identified network costs rose from 40% to 70% of total interconnection costs from the pre-2014 period to the most recent five-year period, as shown in the image below. They concluded that interconnection requests that are assigned large transmission upgrades “tend to withdraw from the process.”

Although energy-only service (known as ERIS) would be expected to “trigger fewer network upgrades” than “capacity” service (known as NRIS), the researchers said their analysis quantitatively supports the hypothesis by Duke University researcher Tyler Norris “that the distinction between these two service requests in practice is not well defined and is subject to transmission provider business rules that are not always clear.”
Transparent data
To create a key dataset of more than 5,000 projects, researchers needed to manually extract interconnection cost data from PDFs provided by grid operators, an effort requiring over 2,000 labor hours, as Berkeley Lab’s energy markets and policy division reported in an overview of the study.
While the Federal Energy Regulatory Commission has issued Order 2023 to improve generator interconnection, implementation of the order “can vary among grid operators and continued analysis is needed to track progress,” says the overview, adding that the same is true of FERC Order 1920 to improve transmission planning processes.
“More data and outcome transparency” would allow key stakeholders “to monitor the health of interconnection institutions,” the study says.
Average network upgrade costs
Across all generating projects in the six interconnection queues studied, dating back at least as far as 2010, average network upgrade costs ranged from about $200 per kW of capacity for solar projects larger than 400 MW (black bar in the image below) to $300 per kW for solar projects under 25 MW (lightest gray bar). Fossil gas units had much lower network costs.

Point of interconnection costs for solar and storage projects were typically below $50/kW, as shown in the image below.

Decarbonization goals
Researchers projected that if current project completion rates held through 2027, the annual installation rate of renewable generation and storage will be below the near-term ramp-up of installed capacity modeled in leading decarbonization studies.
The current volume of queue requests “vastly exceeds” the physical availability of interconnections today, which could “significantly impact” future withdrawal rates and project delays, and “even lead completion rates to decrease” in the near term to medium term. Such results suggest that long-term US energy transition targets “will be difficult to meet without reductions in current withdrawal rates or interconnection durations.”
Interconnection durations in the grid regions studied increased from an average of 33 months in 2010 to 56 months in 2023.
Recommendations
The authors suggested additional potential solutions, consisting of interconnection reforms, tighter links between long-term transmission planning and project-level interconnection processes, possible changes to cost assignment for network upgrades, and technology fixes. They also pointed readers to 30 recommendations made by the U.S. Department of Energy in its Transmission Interconnection Roadmap.
This content is protected by copyright and may not be reused. If you want to cooperate with us and would like to reuse some of our content, please contact: editors@pv-magazine.com.


By submitting this form you agree to pv magazine using your data for the purposes of publishing your comment.
Your personal data will only be disclosed or otherwise transmitted to third parties for the purposes of spam filtering or if this is necessary for technical maintenance of the website. Any other transfer to third parties will not take place unless this is justified on the basis of applicable data protection regulations or if pv magazine is legally obliged to do so.
You may revoke this consent at any time with effect for the future, in which case your personal data will be deleted immediately. Otherwise, your data will be deleted if pv magazine has processed your request or the purpose of data storage is fulfilled.
Further information on data privacy can be found in our Data Protection Policy.