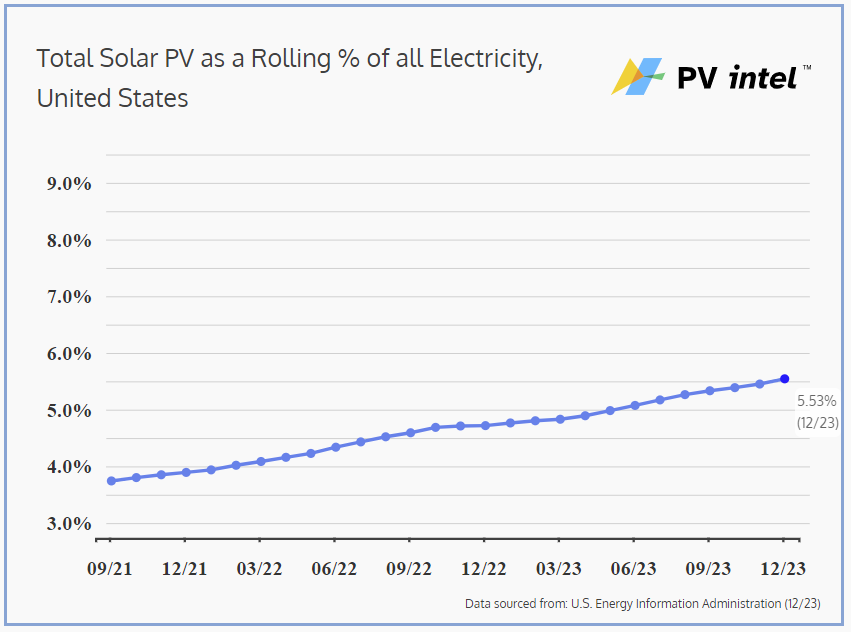
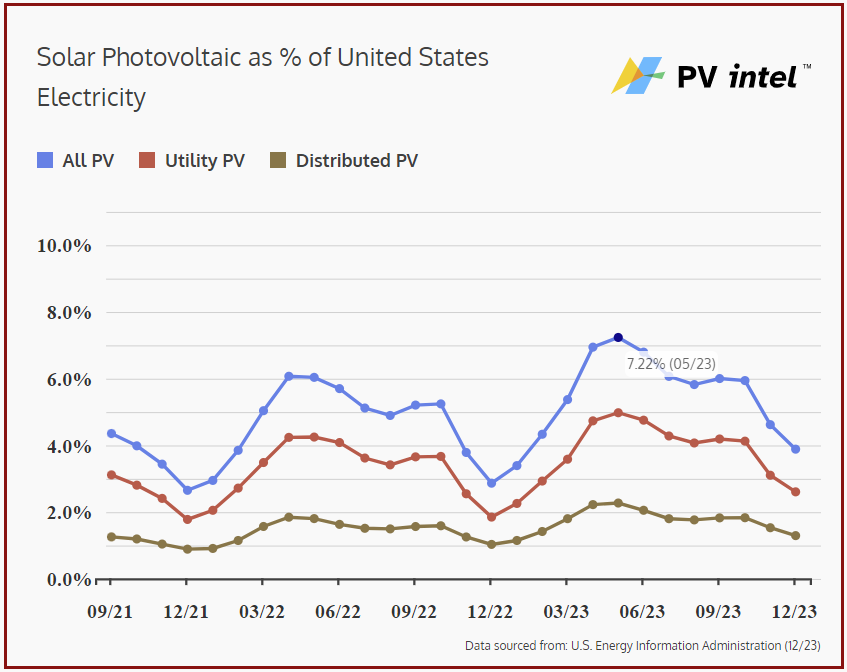
In 2023, solar photovoltaics accounted for 5.5% of total U.S. electricity generation, which amounted to 4,251 TWh. Utility-scale solar (1 MWac and larger) contributed 3.8% to the total electricity generation, while the remaining 1.7% was generated by small-scale solar. Overall, solar’s share of total generation increased by 17.5% from 2022’s 4.7%.
However, the growth rate of solar power declined somewhat over the previous year. In 2022, solar output increased by 40.6 TWh, while in 2023, it increased by only 33.2 TWh, even less than the 33.9 TWh increase in 2021.
The growth in 2023 was primarily based on the 20.2 GW of solar capacity deployed in 2022, which was a decrease from the 23.6 GW deployed in 2021. The slowdown in 2022 can be attributed to various factors affecting the supply chain, including COVID-19, fluctuations in module demand and polysilicon availability, and discussions around U.S. import tariffs.
With an expected deployment of 35 GW in 2023, a nearly 25% increase in total capacity, the share of solar in the generation mix is also expected to grow by about 25%.
If electricity demand remains flat in 2024, and growth is 25%, then solar could account for 6.9% of all electricity generated this year.
With a record 53 GWdc of new capacity expected to be deployed in 2024, growing the nation’s physical solar fleet by over 30%, solar could reach 9.0% of all electricity generated in 2025. This means solar is on track to generate well more than 10% of all electricity in 2026.
The data was released by the U.S. Department of Energy’s Energy Information Administration (EIA) in their Electric Power Monthly report for December. PV Intel processed the data, and supplied it to pv magazine USA via its 50 States of Solar series.
For the year, solar’s monthly share of electricity ranged from a peak of 7.2% in May to a low of 3.4% in January. Solar thermal electricity contributed 0.07% of all electricity generated, showing a slight decrease.
The EIA reported that total electricity demand for the year decreased by just under 1% from 2022’s 4,291 TWh generation. This year’s total generation is the second highest ever recorded in the U.S., second only to 2022.
Emission-free electricity, which includes nuclear, wind, hydroelectric, solar PV, geothermal, and solar thermal, met 39.9% of all U.S. electricity demand for the year. Nuclear accounted for 18.2%, wind for 10%, hydroelectricity for 5.6%, geothermal for 0.4%, and solar thermal for 0.07%. Hydroelectricity continued its decline from a recent high of 7.4% in 2017.
April saw the highest monthly share of emission-free electricity for the year at just over 45%, although it was slightly lower than the previous April. On April 2, at 1 p.m., according to the EIA’s Hourly Electric Grid Monitor, the lower 48 states reached 56.3% of their power grids being driven by emission-free sources.
Wind and solar together met 15.5% of all generation over the last twelve months, a 4.7% increase from 2022. All of this growth came from solar power, as wind power actually decreased in 2023. The peak month for wind and solar was April, coinciding with the peak month of emission-free electricity.
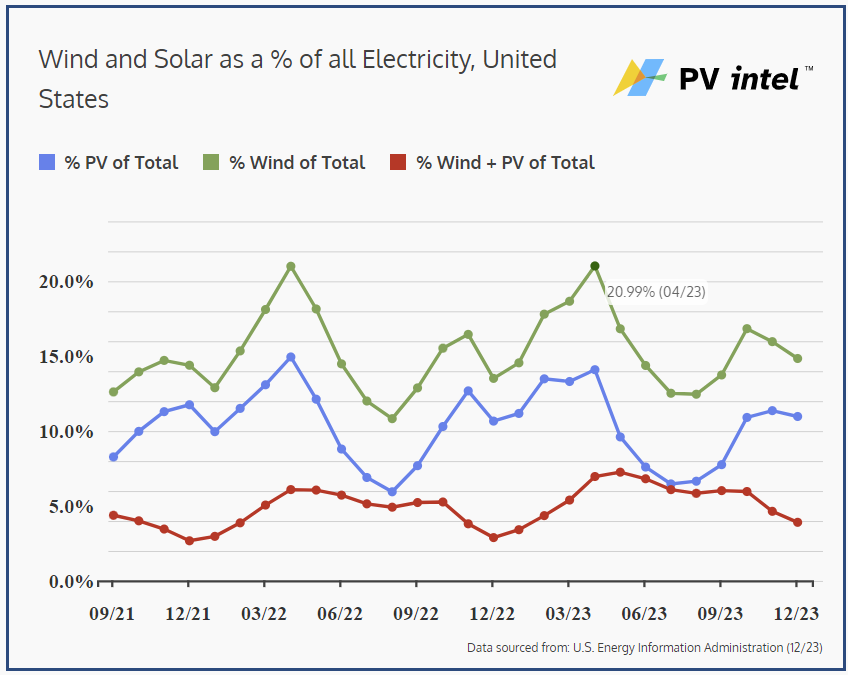
The highest absolute generation month for solar is generally July, while wind peaks in March or April. The wind and solar values peak in the “shoulder seasons” of spring and fall, during periods of lower electricity demand.
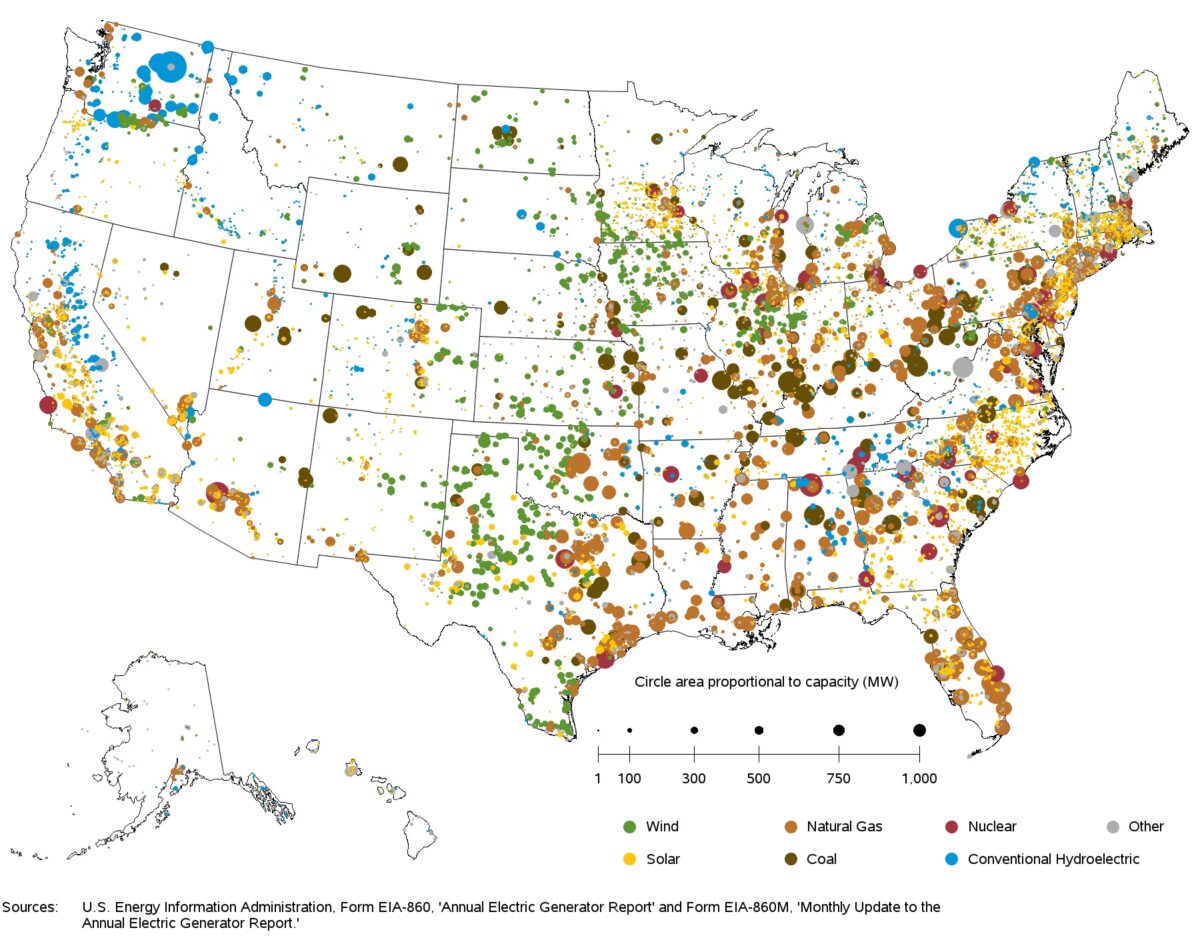
The EIA also released its final power plant map and count for 2023. In total, the EIA tracked 6,197 solar power photovoltaic plants in the nation at the end of year, out of 25,889 total power plants. The Solar Energy Industries of America suggests we’re nearly at, and potentially have already surpassed, 4 million total solar power plants, including all small-scale residential and commercial facilities.
Of the solar facilities tracked by the EIA, the total capacity reached 89,451 GWac as of the end of 2023. In 2023 alone, 399 facilities with a combined capacity of 17.675 GWac were brought online. Among these, the largest were the 500 MWac Aktina Solar and Roseland Solar Project, constructed by Hecate and Enel, respectively, in Texas.
In fact, four of the top five largest new solar power plants built in the U.S. in 2023 were located in Texas.
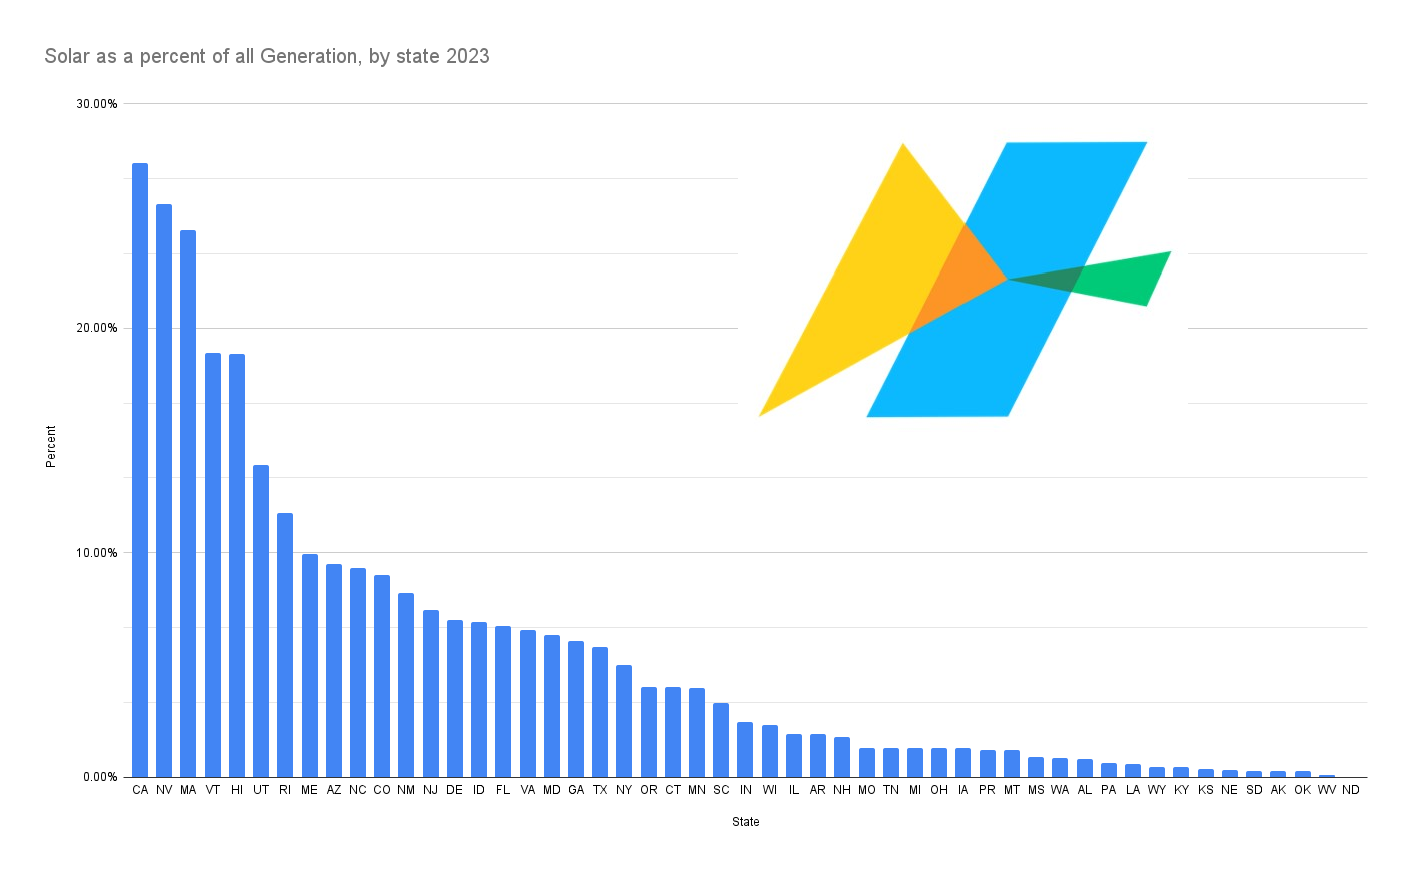
At the state level, California was the national leader, generating 27% of their electricity from solar. Nevada and Massachusetts followed closely, each producing over 20% of their electricity from solar. Notably, in Massachusetts, more than 15% of its electricity came specifically from small-scale solar. Other states, including Hawaii, Rhode Island, Vermont, and even Washington D.C., also made significant contributions, with each generating nearly or just above 10% of their electricity from small-scale solar.
This article was amended on March 5, 2024 to say that solar could reach 9.0% of all electricity generated in 2025 rather than 8.4%.
This content is protected by copyright and may not be reused. If you want to cooperate with us and would like to reuse some of our content, please contact: editors@pv-magazine.com.


By submitting this form you agree to pv magazine using your data for the purposes of publishing your comment.
Your personal data will only be disclosed or otherwise transmitted to third parties for the purposes of spam filtering or if this is necessary for technical maintenance of the website. Any other transfer to third parties will not take place unless this is justified on the basis of applicable data protection regulations or if pv magazine is legally obliged to do so.
You may revoke this consent at any time with effect for the future, in which case your personal data will be deleted immediately. Otherwise, your data will be deleted if pv magazine has processed your request or the purpose of data storage is fulfilled.
Further information on data privacy can be found in our Data Protection Policy.