From pv magazine global
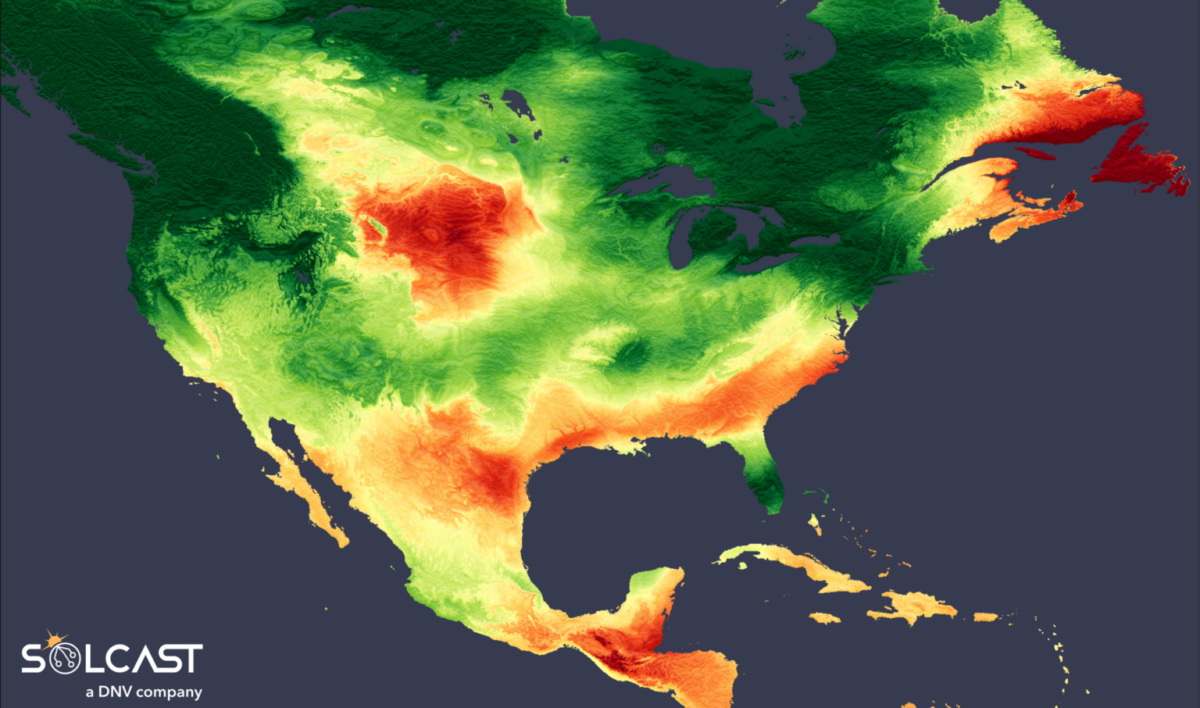
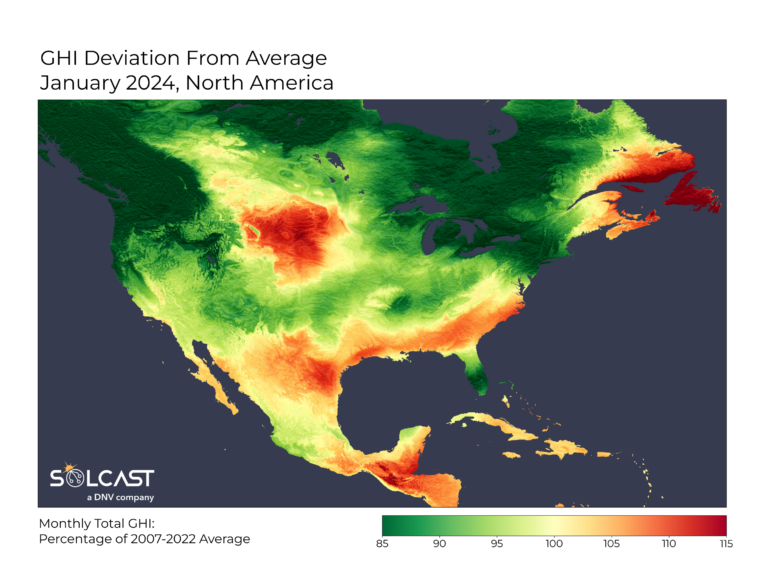
Most of North America saw irradiance below average, primarily due to the stormy conditions that prevailed during the second half of January, according to data analyzed by Solcast via the Solcast API. Despite a cold and dry start in the north, low pressure over the Pacific drove moisture across the West Coast, delivering below-average irradiance. Humidity in the Gulf led to cloud and rain over Florida, but left a wide strip of clear dry conditions and high irradiance from Mexico to the Carolinas.
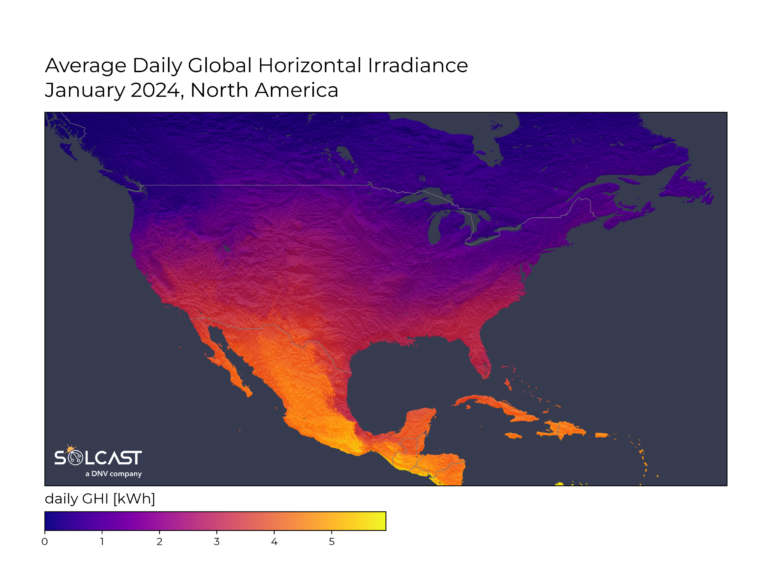
In January, northern latitudes typically receive the lowest monthly irradiance they will all year, due to short days and the sun being low in the sky, as well as winter storm fronts. This means that in locations further north even large increases relative to the average, might be low in terms of daily irradiance received or power generated by solar assets.
The early days of January were dominated by a polar vortex that brought a surge of cold air across the North Western region, pushed by a high-pressure system in the Pacific. This caused Vancouver’s record-breaking low temperature, with morning lows down to -16 C. On the other side of the continent, a similar low-pressure system led to cold and dry conditions in the North Eastern tip of the continent.
Mid-month, a sudden shift brought about by a deep low-pressure system north of Hawaii reversed the patterns earlier in the month, driving moisture and cloud from the Pacific onto the West Coast. This pattern prevailed, leading to the lower-than-average irradiance seen in the total monthly results. Just a few weeks after the record low, Vancouver saw record January high temperatures at 14.3 C.
From Baja to the Carolinas, there was a band of higher-than-normal irradiance. Other than Florida, the Gulf Coast received irradiance 10 to 20% above average for January. A stream of humidity across Central America led to rain and cloud across Florida and the Caribbean. This pattern also led to the drier conditions further north.
Solcast produces these figures by tracking clouds and aerosols at 1-2km resolution globally, using satellite data and proprietary AI/ML algorithms. This data is used to drive irradiance models, enabling Solcast to calculate irradiance at high resolution, with typical bias of less than 2%, and also cloud-tracking forecasts. This information is used by more than 300 companies managing over 150 GW of solar assets throughout the world.
The views and opinions expressed in this article are the author’s own, and do not necessarily reflect those held by pv magazine.
This content is protected by copyright and may not be reused. If you want to cooperate with us and would like to reuse some of our content, please contact: editors@pv-magazine.com.


By submitting this form you agree to pv magazine using your data for the purposes of publishing your comment.
Your personal data will only be disclosed or otherwise transmitted to third parties for the purposes of spam filtering or if this is necessary for technical maintenance of the website. Any other transfer to third parties will not take place unless this is justified on the basis of applicable data protection regulations or if pv magazine is legally obliged to do so.
You may revoke this consent at any time with effect for the future, in which case your personal data will be deleted immediately. Otherwise, your data will be deleted if pv magazine has processed your request or the purpose of data storage is fulfilled.
Further information on data privacy can be found in our Data Protection Policy.