
Energy Toolbase, a financial modeling platform specializing in solar and energy storage that collects nationwide electricity tariffs and rates, has published an in-depth analysis on the inflation of California’s electricity rates over the past decade. The analysis found that the state’s electricity inflation far outpaced generation inflation, averaging 15.3% from the 2020 through 2023. This surge came on the heels of a comparatively modest six-year span, which saw an average inflation of 1.6%.
Over the whole 9-year period, retail electricity bills from California’s three major utilities rose by at least 47%, with San Diego Gas & Electric spiking 104%. In contrast, the Consumer Price Index (CPI) rose by 28% over the same period.
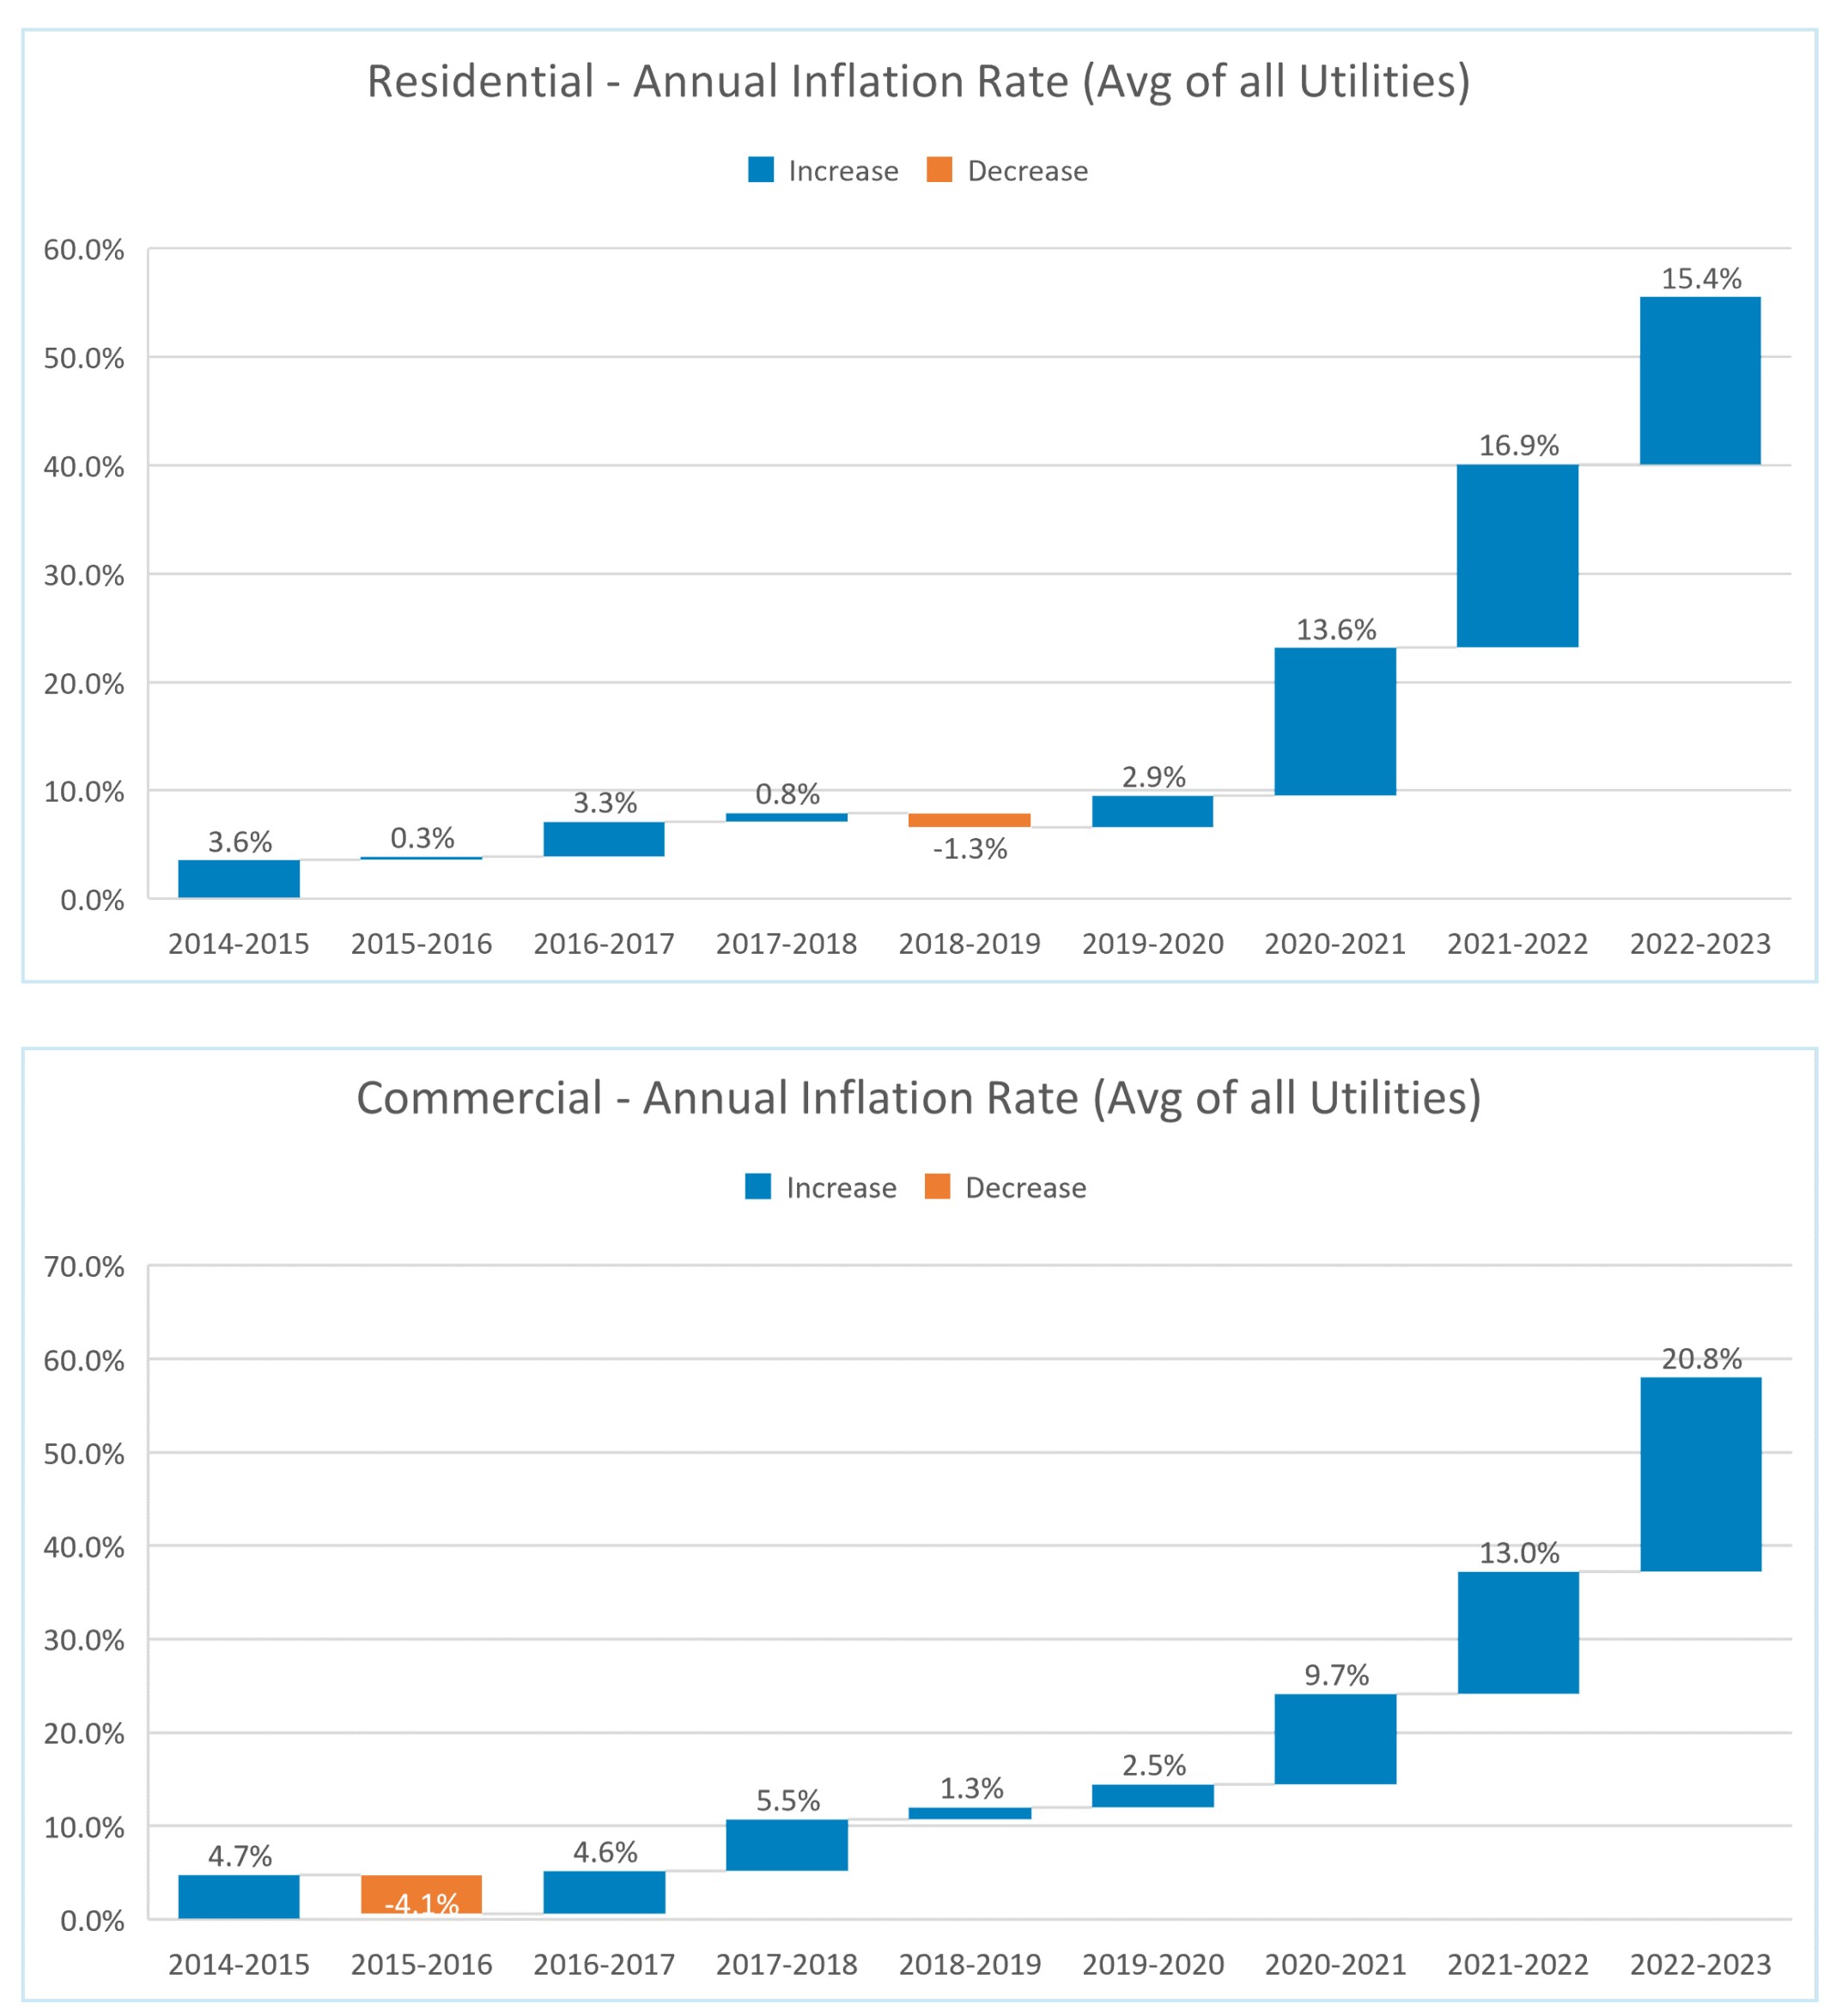
Highlighting how nice we had it from 2014 to 2020, California’s residential and commercial electricity bill prices closely aligned with broader economic trends: the CPI rose by 9.85%, while electricity pricing increased by 9.6%. Essentially meaning that the price of electricity stayed the same when accounting for inflation.
However, from January 2020 through the latest available CPI data in July 2023, electricity prices in the state soared, posting a total inflation of 45.9%. This electricity pricing inflation rate is 271% higher than the general inflation rate of 16.9% over the same period.
Although recent CPI suggests a 20% deflation in energy commodities and falling electricity prices in many markets, these trends haven’t materialized in California.
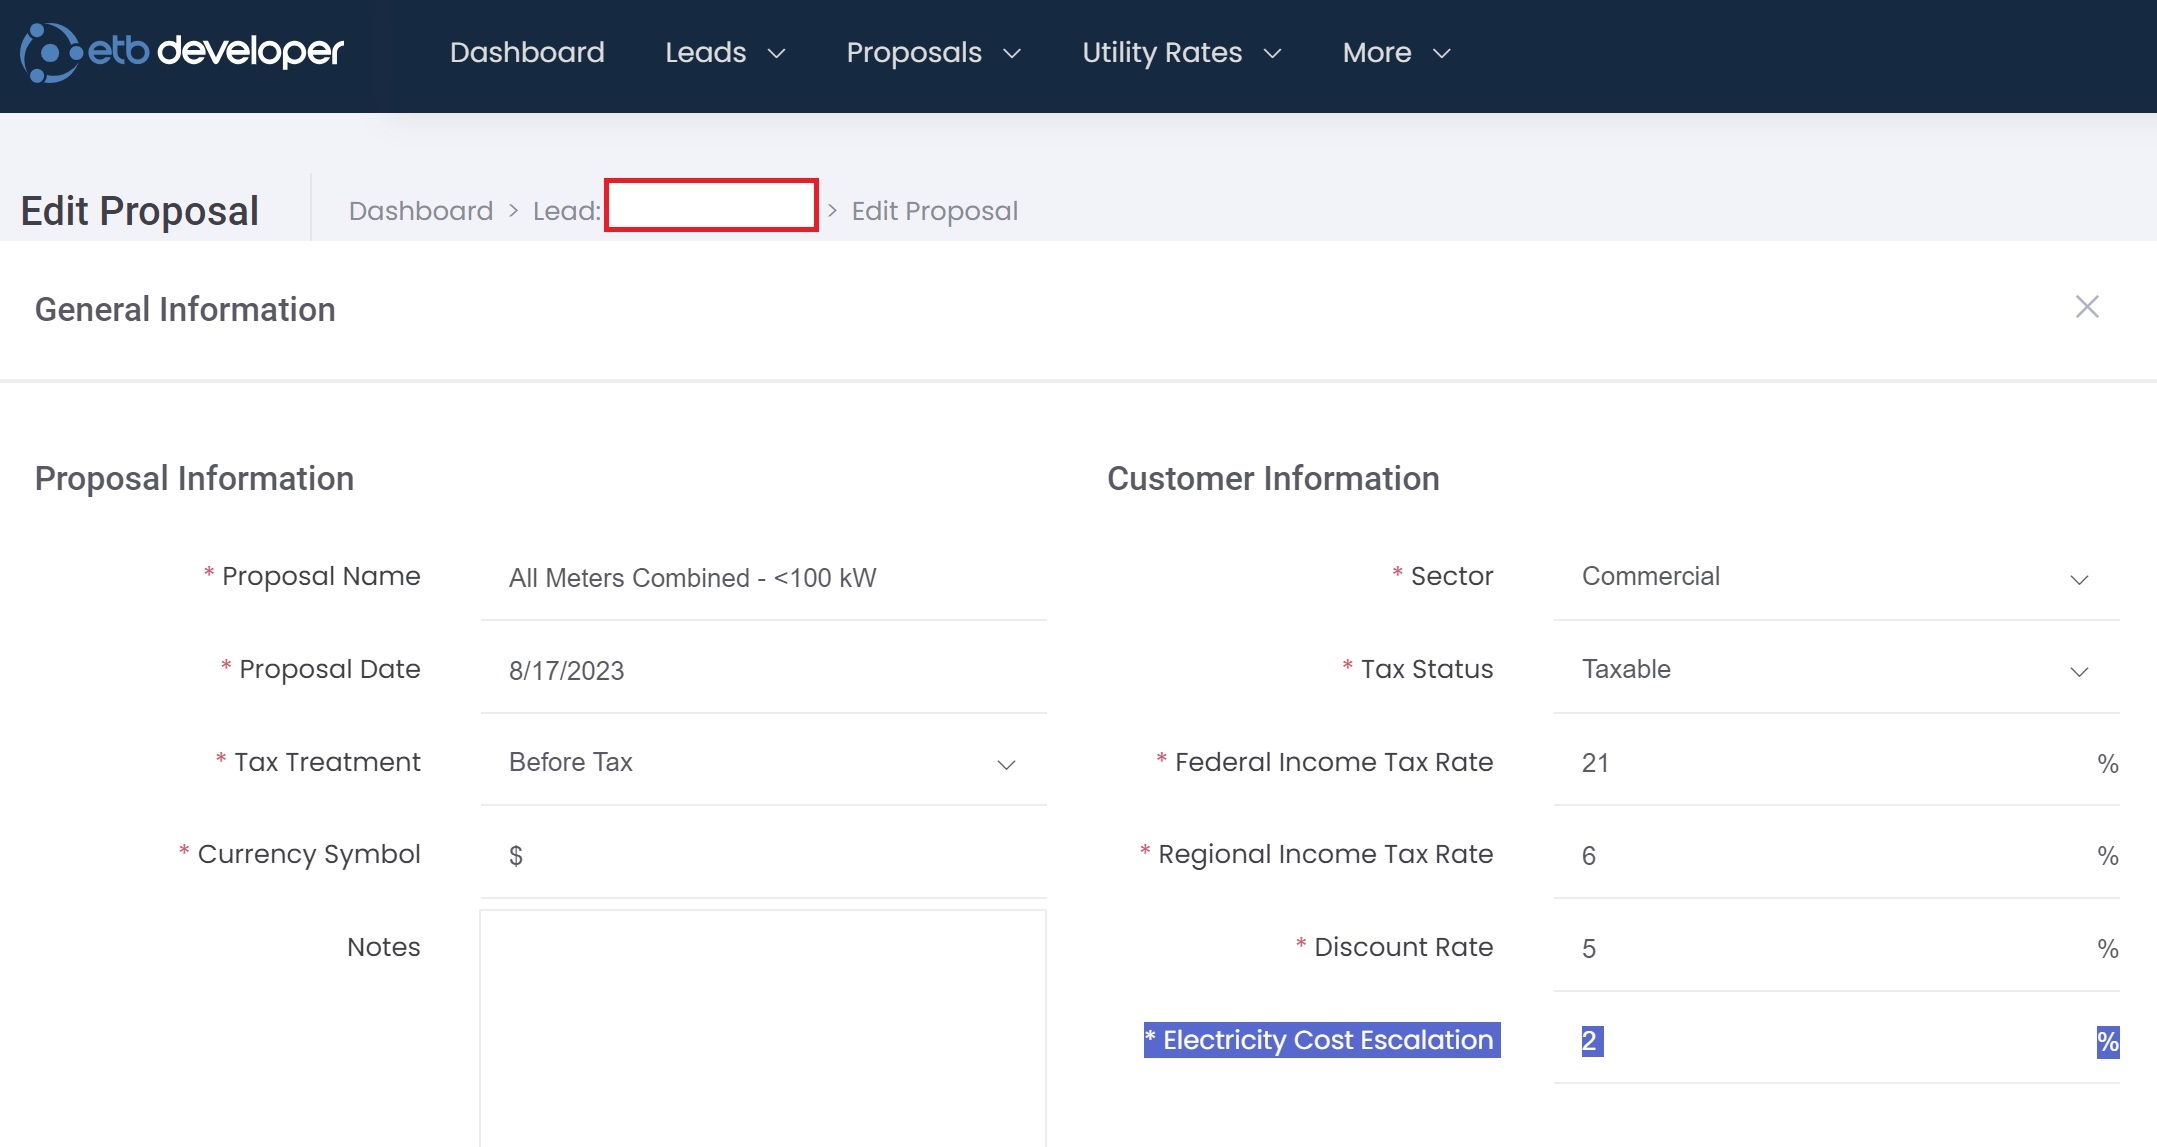
Energy Toolbase conducted the analysis to help solar developers better predict future electricity prices. The study recommended using a compound annual growth rate of 3.9% to 7.4%, depending on the utility, in the Electricity Cost Escalation field of its ETB Developer software.
Having reliable electricity inflation data is valuable not only for creating robust financial models for customers bt ualso for mitigating risks. This is especially relevant as third-party lease companies have faced legal challenges when their projected electricity inflation rates fell flat.
Energy Toolbase also highlighted changing financial returns on solar investments in California due to NEM-3. Solar exports under this new standard are estimated to be roughly 75% less valuable on average compared to NEM-2.
The study identified five major drivers of electricity price increases in California. Fuel and energy costs play a critical role, especially given that recently volatile methane gas prices fuel half of the state’s electricity generation. Demand shifts, spurred by vehicle electrification, population growth, and economic conditions, are also affecting prices. Regulatory changes, like the Public Purpose Program surcharge, and environmental mandates such as renewable portfolio standards and grid modernization, impose further costs. Infrastructure maintenance and upgrades also play a role, sometimes offset by solar investments. Notably, California’s investor-owned utilities spent nearly $11 billion in 2021 and 2022 for wildfire mitigation and grid enhancements, some of which also went to settlements. These costs are expected to be borne by ratepayers over the next 15 years.
This content is protected by copyright and may not be reused. If you want to cooperate with us and would like to reuse some of our content, please contact: editors@pv-magazine.com.


This report should be an eye-opener, to potential electric vehicle
customers. How high will electric prices go? No one knows! I just don’t
see how consumers can pay more.
You forgot to mention that California IOU’s are a 100 year old monopoly and get a guaranteed rate of return on all of their capex investment.
I wish Energy Toolbase would run this analysis for utilities all over the US!
They do not get a guaranteed rate of return. Rates are set so they will realize a reasonable return if they manage the system well.