From pv magazine global
July witnessed record-breaking heatwaves globally, severely impacting lives and livelihoods. In North America, high pressure led to unprecedented minimum overnight temperatures and clear sky days in the South and West. Consequently, temperatures and irradiance outperformed the long-term July average. However, in contrast, Canada and the Eastern US experienced reduced irradiance due to low pressure and unsettled rain, resulting in a three-month rainfall total in just 24 hours in parts of Nova Scotia.
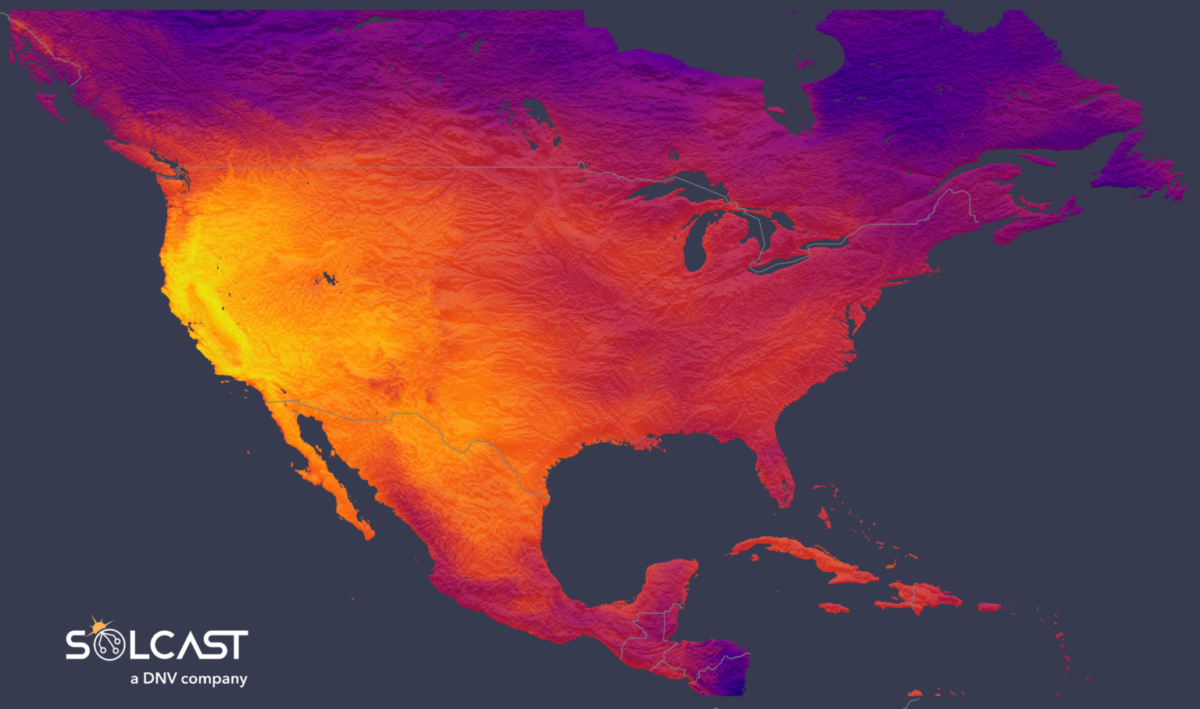
Unprecedented heatwaves swept across western North America this month, with daily lows reaching record-breaking highs. Phoenix, Arizona, saw an all-time high daily minimum temperature exceeding 36 C (97 F), while midnight temperatures in Death Valley, California, soared to a staggering 49 C (120 F). North America’s northernmost town, Utquiagvik, Alaska, recorded its warmest single day, surpassing the previous record by almost 4 C (39 F). In Mexico, tragic heatwaves resulted in more than 200 deaths since June, with over 100 in July alone.
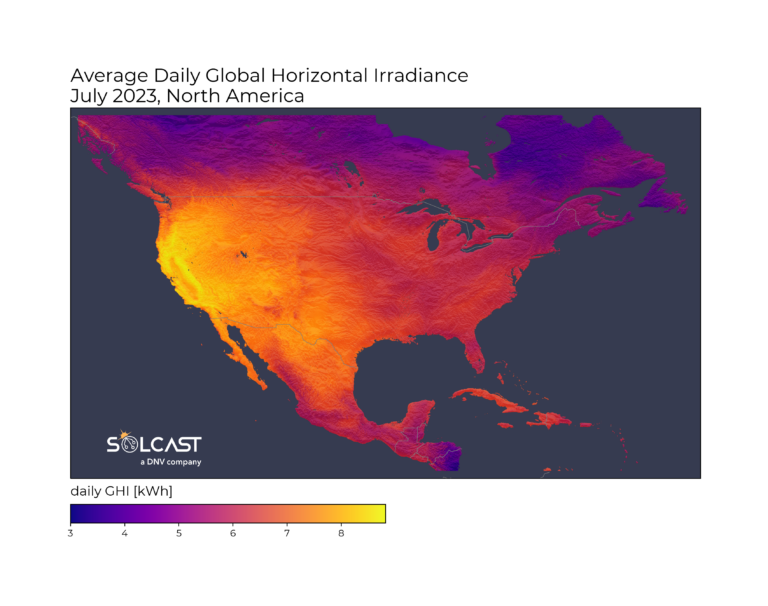
July’s high pressure in the southwest and trough in the northeast dramatically influenced North America’s solar energy production. Persistent high-pressure systems in the southwest led to frequent clear skies and warm air masses, driving up solar irradiance and enhancing
potential solar power generation.
Conversely, the northeast experienced numerous cold fronts and unsettled weather. The ensuing cloud cover and rainfall significantly reduced sunlight and solar energy output. Eastern Canada faced devastating floods due to the heaviest rainfall to hit Nova Scotia in over 50 years, with three months worth of rain falling in just one day.
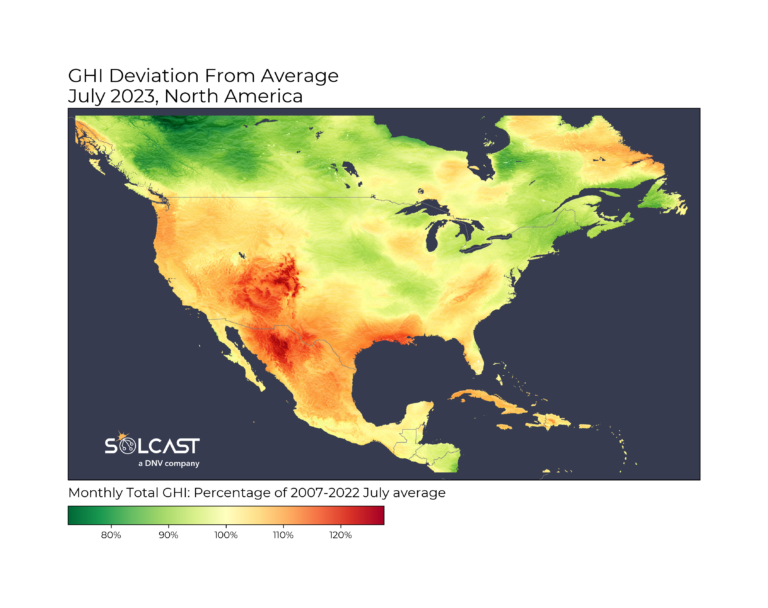
According to Solcast data collected via the Solcast API, solar irradiance across most of the southern and western United States soared to 10% to 25% higher than long-term July averages. However, solar generation will have been severely affected by high temperatures, leading to
decreased panel efficiency and increased heat losses.
Solcast generates this monthly total data before the month-end through a mix of historic data and modeled forecasts from the Solcast API, with the total summary for July including forecast data for the final four days.
Solcast produces these figures by tracking clouds and aerosols at 1-2km resolution globally, using satellite data and proprietary AI/ML algorithms. This data is used to drive irradiance models, enabling Solcast to calculate irradiance at high resolution, with typical bias of less than 2%, and also cloud-tracking forecasts. This data is used by more than 300 companies managing over 150 GW of solar assets globally.
The views and opinions expressed in this article are the author’s own, and do not necessarily reflect those held by pv magazine.
This content is protected by copyright and may not be reused. If you want to cooperate with us and would like to reuse some of our content, please contact: editors@pv-magazine.com.


By submitting this form you agree to pv magazine using your data for the purposes of publishing your comment.
Your personal data will only be disclosed or otherwise transmitted to third parties for the purposes of spam filtering or if this is necessary for technical maintenance of the website. Any other transfer to third parties will not take place unless this is justified on the basis of applicable data protection regulations or if pv magazine is legally obliged to do so.
You may revoke this consent at any time with effect for the future, in which case your personal data will be deleted immediately. Otherwise, your data will be deleted if pv magazine has processed your request or the purpose of data storage is fulfilled.
Further information on data privacy can be found in our Data Protection Policy.