
The solar industry is forecast to build as much capacity in the next five years as it has over the previous two decades. As the industry matures, risk assessments support the build out of bankable projects that perform at a high level.
This is the motivation behind the annual kWh Analytics Solar Risk Assessment report, now in its fifth year. In the 2023 report, the firm highlights key risks in extreme weather, finance, and asset operations.
(Read part one: Extreme weather)
“Mitigation of these risks will be critical to our industry’s shared goal: investment of capital into solar to attain sustainable growth,” said Jason Kaminsky, chief executive officer, kWh Analytics. “Doing so will require industry leaders to continue working together as new environmental, technological, legislative, and economic challenges arise.”
1) Production modeling improperly evaluates downtime events
kWh Analytics found that equipment outages and downtime events are contributing significantly more downside risk than would be expected using normally distributed performance curves. Tail events called P99 scenarios are occurring much more frequently than modeled.
A P99 scenario refers to a statistical analysis used to assess the reliability or availability of a solar asset. The term represents the 99th percentile, as an indication that the analysis focuses on extreme conditions that are expected to occur only 1% of the time or less.
With solar assets, a P99 scenario typically involves evaluating performance under unusually high-demand conditions or challenging circumstances. This scenario helps identify potential weaknesses or vulnerabilities in the system. For example, in the case of a power plant, a P99 scenario might involve simulating the plant’s performance during a peak demand period, extreme weather events, or equipment failures.
“Optimistic uncertainty assumptions result in both an under-estimation of the severity of downside events as well as an overestimation of upside events,” said kWh Analytics. “Analyses of the actual P99s used in project financing have shown that the combination of optimistic P50’s and inadequate downside uncertainty results in P99 events occurring 17 times more frequently than expected.”
Significant recurring inverter failures, ground faults, and manufacturer defects are some specific events that are driving tail event “P99” outcomes, said kWh Analytics.
2) Median asset availability is 97.7%, fixed-tilt projects are less available
Availability of a solar asset is the overall percentage of time it is operational. Based on an assessment of 130 projects from 5 MW to 500 MW operating from 2013 to 2022 across the U.S., strategic consultant firm ICF found that the median annual availability of PV projects is 97.7%.
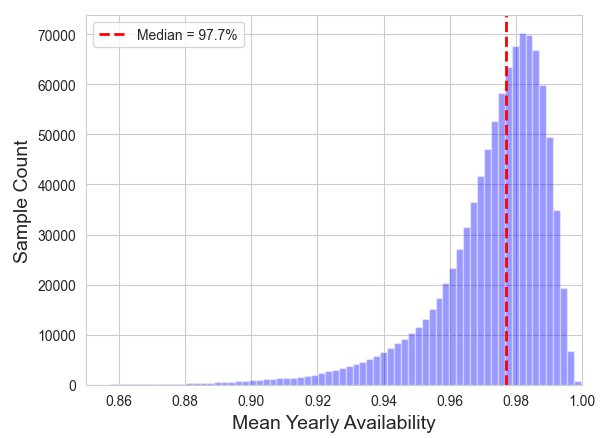
ICF found lower availability in the first year of operation, but this varies significantly project-to-project. The firm said that there are several projects that have achieved 99% or greater availability, and it has identified differences in design and operations and maintenance practices that are common among the highest-availability projects.
The firm also found that fixed tilt systems had lower availability than tracker systems, which ICF said is likely due to the fixed tilt systems generally representing smaller, unmanned facilities.
“A few examples of specific O&M practices which we have seen improve project availability are shorter response times specified in the O&M contract, higher frequency or higher sampling of certain preventative maintenance activities, and higher availability guarantees utilizing metrics that capture DC-level performance,” said ICF.
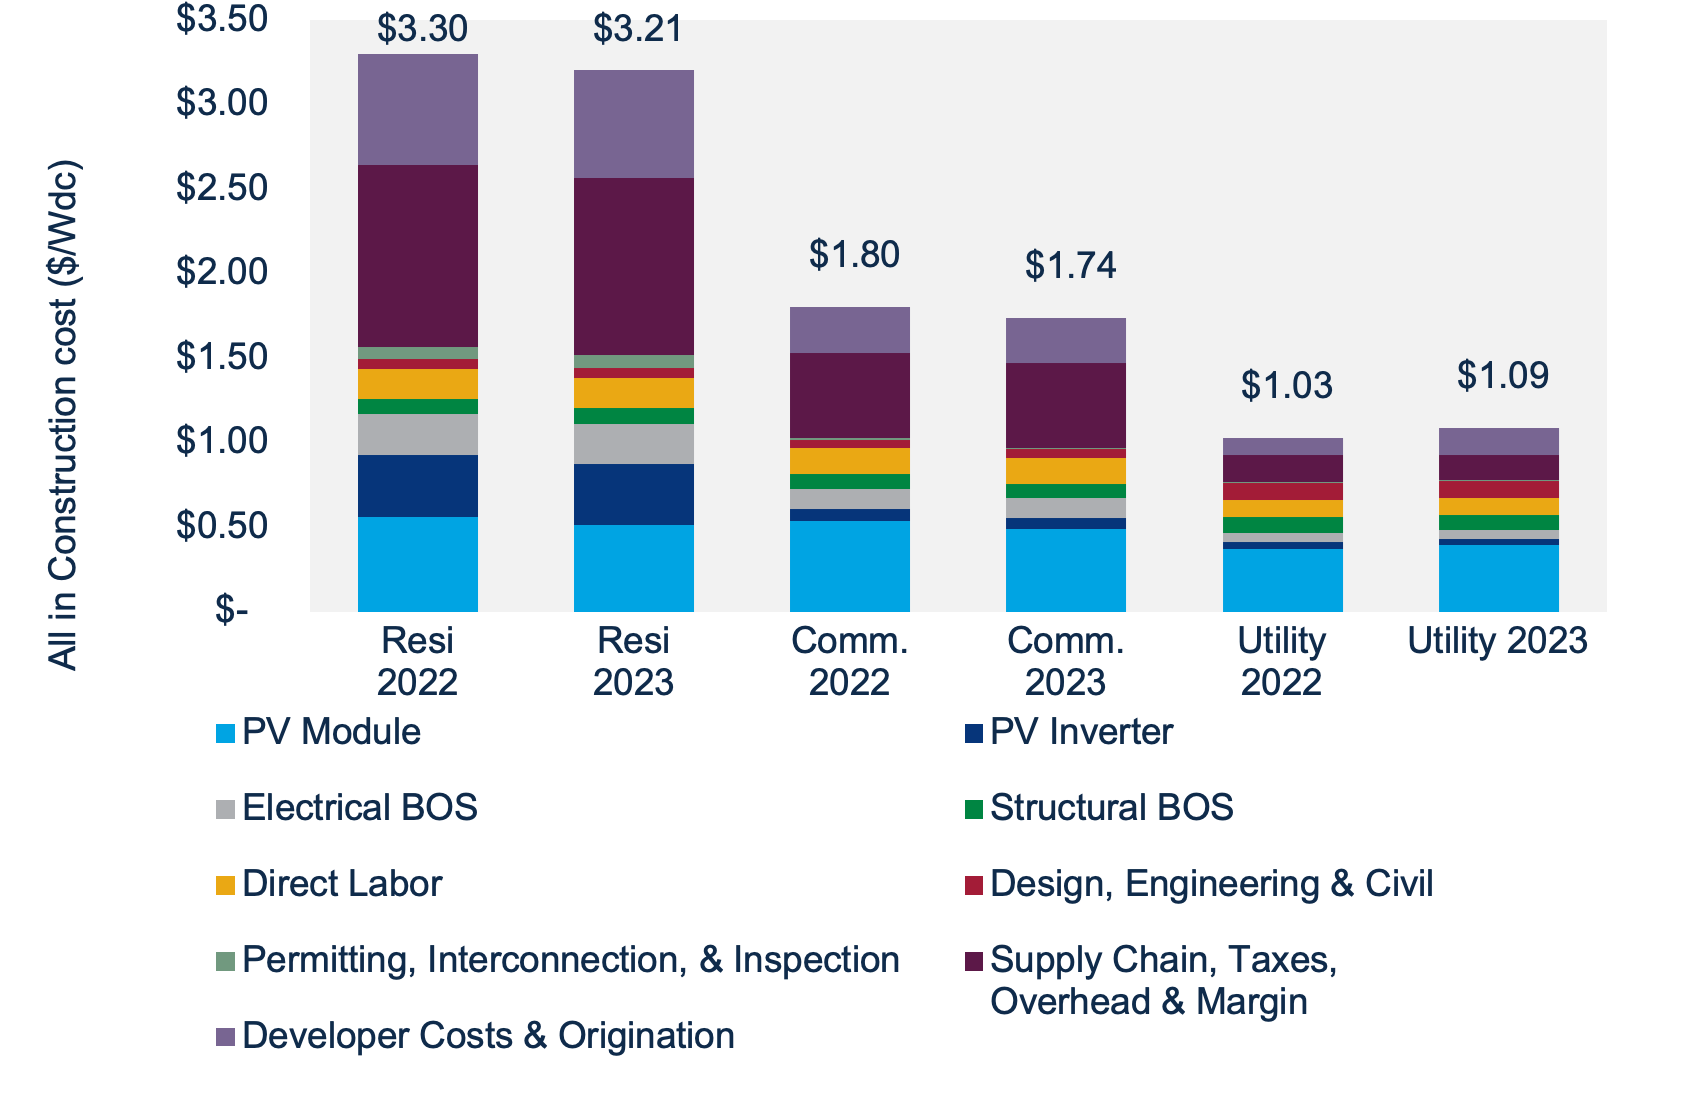
3) Capital costs for DG solar to decline, supply chain delays keep utility-scale costs high
Forces of global inflation, Russia’s invasion of Ukraine, and anti-dumping duties for module procurement have cause a high-cost environment for U.S. solar in 2022, said Sagar Chopra, research analyst for Wood Mackenzie.
Chopra said the price of mono-grade polysilicon ballooned from $11 per kg in early 2021 to a peak of $44 per kg at the end of 2022. Prices have since declined as over 1 million metric tons of capacity is planned to come online by the end of 2023.
System costs for distributed solar projects, both residential and commercial, are expected to decline 3% this year, aided by a decline in module costs and advancements in module technology.
However, Chopra warns that utility-scale system costs will increase about 6% this year on average for projects averaging 100 MW. This is due to a one-year lag in procurement. Additionally, labor rates have risen anywhere from 4% to 10%, and prevailing wage requirements will increase this further, said Wood Mackenzie.
4) US module prices to plummet below $0.30 per watt as tariff dust settles
Once the Biden Administration moratorium on solar tariffs lift, solar cells from China will likely need to pay import taxes to enter the U.S. from June 2024 onward. Pol Lezcano, research analyst for BloombergNEF said large solar manufacturers are preparing for this risk by building over 35 GW of annual wafer manufacturing capacity in Southeast Asia to avoid new tariffs.
BloombergNEF said over 50 GW of tariff-immune annual cell production will be online in Southeast Asia by the end of 2024. This production would be enough to meet the firm’s projected U.S. demand of 42 GW to 52 GW between 2025 and 2030.
Lezcano noted that while capacity will be moved out of China to avoid tariffs, detainments of goods enforced under the Uyghur Forced Labor Prevention Act are being released. Customs Border Patrol reports about half the detained products have been released to date. The other half remain stuck in review, and less than 2% have been denied entry.
“By 2025, module prices for the US could fall well below $0.30 per watt, compared with a range of $0.38-0.44 per watt in 2023 and 2024,” said Lezcano. “However, many U.S. module assembly factories will struggle to be cost competitive with best-in-class plants in Southeast Asia, even after lucrative US subsidies.”
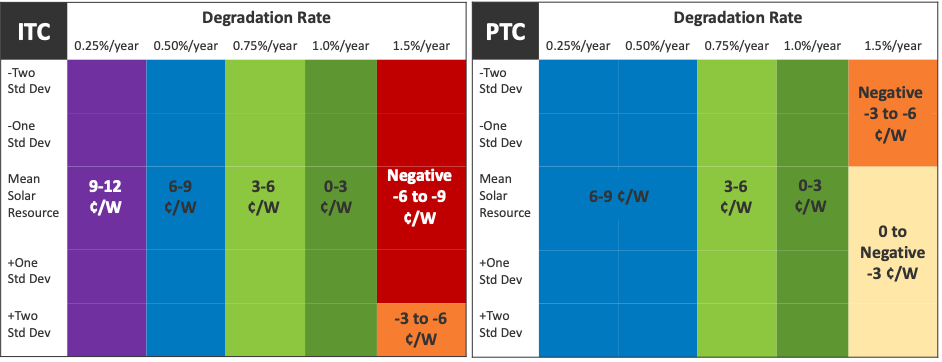
5) Uncertainty in degradation
The Investment Tax Credit (ITC) and the Production Tax Credit (PTC) are two core incentives that support the value of projects. The National Renewable Energy Laboratory (NREL) warns that the different nature between these two incentives may shape decisions on technology choice.
“The ITC could make more sense for more expensive systems where it is desirable to reduce the payback time—perhaps due to technology and underperformance risk. The PTC, on the other hand, is based upon the power that is produced over multiple years of operation—so it could be more attractive for longer-term system owners in high solar resource areas,” said NREL.
NREL said bifacial technologies were calculated to have a 4.5% to 6.5% gain in annual specific energy yield, which the lab said translates to higher potential values for the technology.
“But the value varies between credits and depends significantly upon the assumed degradation rate. For both tax credits, even just 0.5—1.0% per year lower-than-expected degradation rate could negate any gains that might be expected from the higher initial energy yield technologies,” said Michael Woodhouse, energy technologies economics analyst, NREL.
Follow up for the third and final part of the risk series based on kWh Analytics reporting. Part three will focus on asset operation risks.
This content is protected by copyright and may not be reused. If you want to cooperate with us and would like to reuse some of our content, please contact: editors@pv-magazine.com.


By submitting this form you agree to pv magazine using your data for the purposes of publishing your comment.
Your personal data will only be disclosed or otherwise transmitted to third parties for the purposes of spam filtering or if this is necessary for technical maintenance of the website. Any other transfer to third parties will not take place unless this is justified on the basis of applicable data protection regulations or if pv magazine is legally obliged to do so.
You may revoke this consent at any time with effect for the future, in which case your personal data will be deleted immediately. Otherwise, your data will be deleted if pv magazine has processed your request or the purpose of data storage is fulfilled.
Further information on data privacy can be found in our Data Protection Policy.