Interconnection and power line upgrades have gained national recognition as crucial steps in accelerating the transition to a cleaner power grid. Recent data on the nation’s interconnection queues reveal a drastic increase in total capacity – and corresponding delays – to over 1.7 TWac, with solar accounting for 947 GWac. To put this in perspective, the nation’s current total solar capacity is approximately 110 GWac to 115 GWac.
A study by Lawrence Berkeley National Laboratory’s Electricity Markets and Policy Group (EMP) of the Southwest Power Pool (SPP) in the central United States indicates that not only are interconnection queue waits growing longer, but many projects also face escalating interconnection costs, leading to their withdrawal from the process.
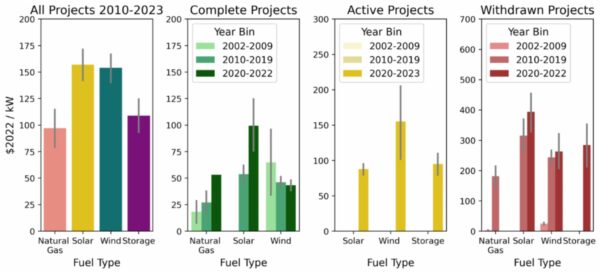
Among the projects analyzed, wind (487) and solar (197) constituted the majority, followed by natural gas (70), and storage (68). The research also covered several hybrid (9) projects, coal (7), nuclear (2), and a single hydropower plant. Specifically for solar, 30 connected projects were analyzed, alongside 114 active projects in the queue, and 53 that had been withdrawn.
Solar projects that chose to withdraw from the interconnection queue faced interconnection costs four to six times higher than those that proceeded with interconnection.
Currently, 114 solar projects moving through SPP’s queue – yet to connect – have received interconnection agreements featuring pricing similar to historically connected projects.
The study found no solar projects to review in the 2002 to 2009 window. However, for projects that did connect during the 2010 to 2019 and 2020 to 2022 periods, interconnection costs doubled. For those projects that withdrew during the same periods, costs increased by 25%, from a high base of $316 per kilowatt of solar, to an even steeper $394 per kilowatt.
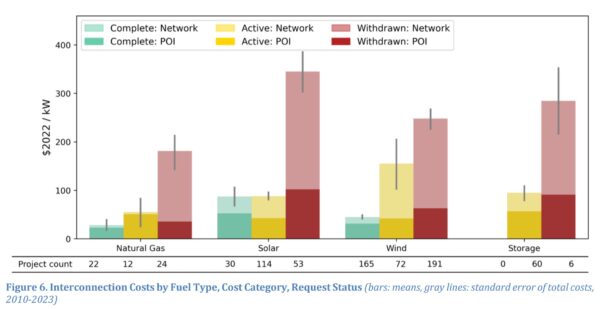
The analysis defines “POI” (point of interconnection) costs as those associated with the solar project site, such as transformers and substation upgrades. Network costs extend beyond the substation and include powerlines.
For solar, while POI costs have decreased, network costs have risen. This trend likely results from solar projects increasing in scale, reducing local POI costs per installed unit. Concurrently, these projects have been moving further away from energy demand centers, leading to higher network costs due to the need for more power line upgrades.
As of 2022, SPP hosted just over 105 GW of generating capacity. The region’s peak load in recent years reached approximately 51 GW. By the end of 2022, an additional 109 GW of generating capacity plus energy storage was in the interconnection queue, with over 96% of it comprising wind, solar, and energy storage.
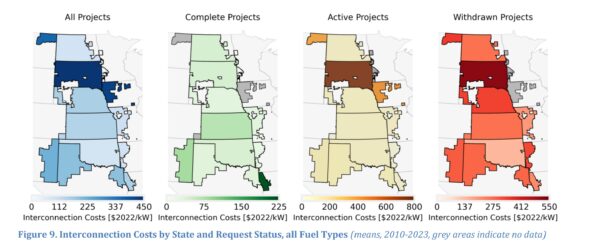
While the analysis of interconnection costs by region was not particularly robust, regions at the extremities of the SPP geography faced higher interconnection costs. When examining different generation types, noticeable differences emerged – for instance, in South Dakota, solar interconnection costs were high while wind costs were low.
According to an analysis by the American Council on Renewable Energy, the interconnection upgrades funded by solar are bringing broader benefits to all power grid users, not just the power plants funding these upgrades. In the SPP power grid region, the group noted that six renewable energy grid upgrades costing over $1.3 billion delivered $340 million in benefits to the broader grid.
This content is protected by copyright and may not be reused. If you want to cooperate with us and would like to reuse some of our content, please contact: editors@pv-magazine.com.


By submitting this form you agree to pv magazine using your data for the purposes of publishing your comment.
Your personal data will only be disclosed or otherwise transmitted to third parties for the purposes of spam filtering or if this is necessary for technical maintenance of the website. Any other transfer to third parties will not take place unless this is justified on the basis of applicable data protection regulations or if pv magazine is legally obliged to do so.
You may revoke this consent at any time with effect for the future, in which case your personal data will be deleted immediately. Otherwise, your data will be deleted if pv magazine has processed your request or the purpose of data storage is fulfilled.
Further information on data privacy can be found in our Data Protection Policy.