From pv magazine global
Raptor Maps has published its latest annual report on global PV system underperformance. The solar lifecycle management software specialist performed aerial inspections across 24.5 GW of large-scale solar systems.
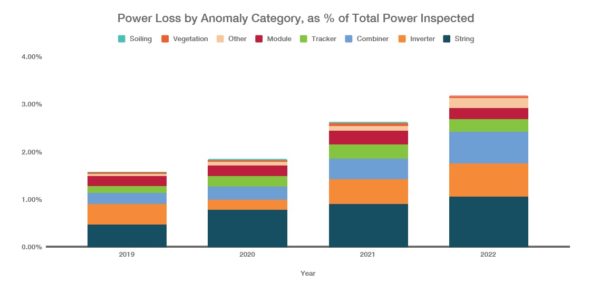
The inspection statistics show that solar assets are becoming more anomalous each year. Underperformance due to anomalies nearly doubled from 1.61% in 2019 to 3.13% in 2022, said the company. Power losses have increased by 94% since 2019, it added, noting that anomaly-driven power losses could grow to almost 6% by 2025 at the current rate.
Raptor Maps estimates annual losses of $82 million for the 24.5 GW of assets it inspected in 2022, at an average of an $3,350 annual loss per megawatt.
“Extrapolating across total global PV capacity (as of the end of 2021, excluding residential) translates to a $ 2.5 billion annual revenue loss for the industry,” the company said.
The report includes data on underperformance by site size and module-level anomalies for the first time. The figures show that smaller sites had the highest average power losses as a percentage of their generation capacity. However, the largest sites exhibited higher average power losses. Sites between 100 MW and 200 MW in size had average power losses of 4.04% – 29% higher than the global average.
“Sites larger than 200 MW are losing, on average, around $4,320 per MW, with some sites losing up to $12,900 per MW,” claimed Raptor Maps.
The report shows that system-level anomalies are the largest drivers of power losses, with string, inverter, and combiner anomalies affecting the most power as a percentage of total power inspected, at 1.06%, 0.70%, and 0.67%, respectively. String anomalies were reportedly responsible for 34% of lost revenue, while inverter and combiner anomalies were respectively responsible for 22% and 21%.
At the module level, Jinko Solar, First Solar, Trina Solar, Canadian Solar, and Longi were the top five manufacturers of inspected assets. Cell and diode anomalies were the most common module-level and sub-module-level anomalies among these manufacturers, according to Raptor Maps. Combined, the two categories accounted for roughly 70% of observed defects. Physical damage accounted for 18% of defects.
Monocrystalline modules were found to be considerably less defective than polycrystalline and thin film technologies, by 65% and 41%, respectively. The inspected thin-film modules were purportedly more susceptive to physical damage such as cracking, delamination, and warping. They showed three times more physical damage than polycrystalline and 12 times more than monocrystalline. Hot spots were also found much more frequently in thin-film modules than in the other two technologies.
“The report underscores the need for asset owners and managers to monitor equipment performance over time, proactively identifying maintenance issues and warranty claim opportunities,” said Raptor Maps.
This content is protected by copyright and may not be reused. If you want to cooperate with us and would like to reuse some of our content, please contact: editors@pv-magazine.com.


Interesting work. I wish we could see a more disaggregated display of the losses, i.e., by module type as mentioned in the article. What was the degradation of First Solar CdTe? From the graph, it seems that system degradation is clearly NOT a module problem. It’s below 1%. This work could help us focus on the other aspects. And it’s a relief that module level losses are within acceptable limits. Are these observations accurate? It’s a little hard for me to read the figure.