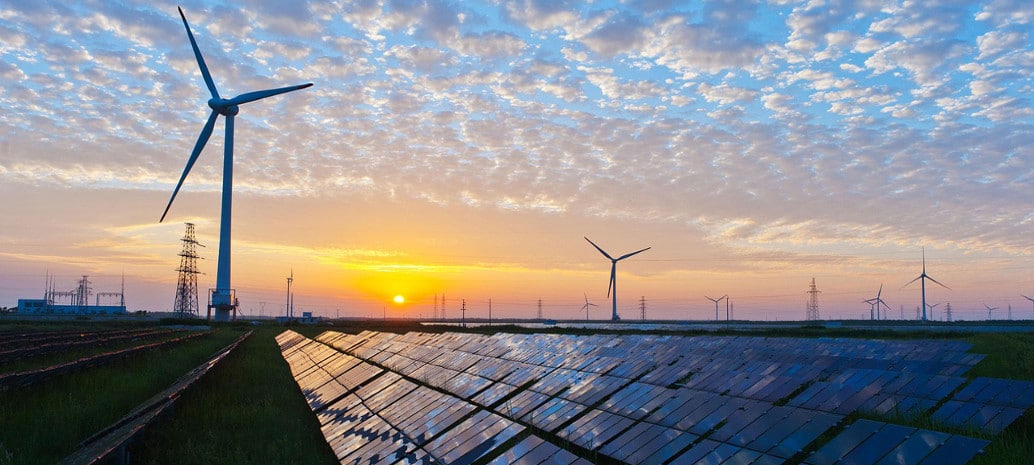
The U.S. continues to ramp up clean power deployment and related investment, with a record 26 GW brought online in 2020.
That brings the total installed capacity of solar, wind, and energy storage to 170 GW, according to the inaugural Clean Power Annual report released by the American Clean Power Association (ACP).
The report said that clean power technologies deliver 10.7% of U.S. electricity and generate enough power for 50 million homes.
New installations included nearly 9 GW of utility-scale solar, 760 MW of battery storage capacity, and 16.8 GW of onshore wind. These three resources combined make up 78% of new power installations in 2020, a shift from the 28% share of new installations in 2010.
Jobs and the economy
The report said that the clean power industry provides jobs to more 415,000 Americans, and wind turbine technician and solar installers are the first- and third-fastest-growing occupations, respectively. Current momentum combined with supportive regulation and policy could deliver over 1 million jobs by 2030, ACP said.
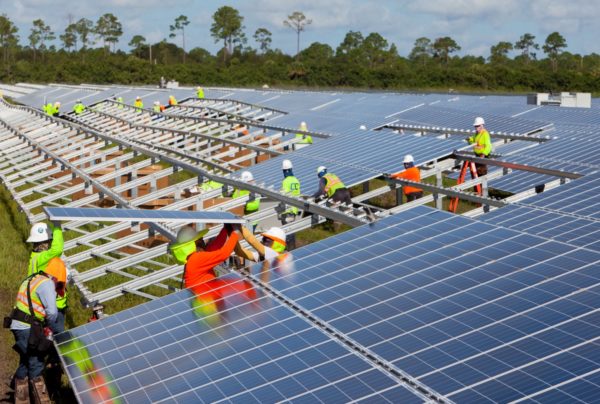
Image: Black & Veatch
The 26 GW of clean power brought online is estimated to equal some $39 billion in investment. Since 2005, total investment in clean energy reached an estimated $334 billion across the U.S. Nearly 90,000 MW of clean energy projects are currently underway, the report said, representing more than $120 billion in new investment.
The industry also paid an estimated $1.7 billion in state and local taxes and nearly $800 million in lease payments to landowners.
Since 2009, the unsubsidized cost of solar has fallen 90% and wind has fallen 71%. In most parts of the country, wind and solar offer the lowest cost of any generation type.
Corporate buyers announced 10,417 MW of clean power contracts and power purchase agreements in 2020, the report said. That nearly equaled the 10,854 MW contracted by utilities. Non-utility businesses had an all-time high share of renewables contracts at 46%.
Who leads the way?
Two-thirds of all U.S. states have at least 1 GW of operational clean power, the report said. Texas leads the nation with 37.4 GW of capacity, followed by California at 20.3 GW, Iowa with 11.4 GW, and Oklahoma and Kansas with 9.4 GW and 7 GW, respectively.
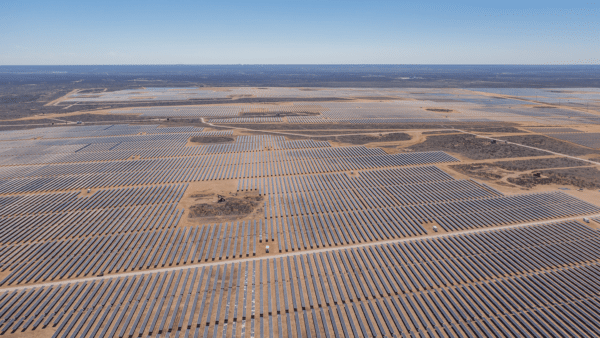
Image: Ørsted
In 2020, Texas also added the most clean power capacity with 6.3 GW. California followed with 2.2 GW, and Florida added more than 1.2 GW. Texas led in both the solar and wind categories, with 3.1 GW and 2 GW respectively. California was the top battery storage adder, bringing online 573 MW of capacity in 2020.
These 2020 projects are estimated to reduce carbon dioxide emissions by 327 million metric tons, the equivalent of taking 71 million cars off the road, the report said.
Reducing carbon emissions, along with sulfur oxide and nitrogen oxide, offer health benefits, including reducing asthma attacks, the report said. This year’s clean energy deployment is estimated to save $16 billion to $41 billion in long-term health benefits due to decreased mortality, respiratory issues, and other pollution-related health impacts.
This content is protected by copyright and may not be reused. If you want to cooperate with us and would like to reuse some of our content, please contact: editors@pv-magazine.com.


By submitting this form you agree to pv magazine using your data for the purposes of publishing your comment.
Your personal data will only be disclosed or otherwise transmitted to third parties for the purposes of spam filtering or if this is necessary for technical maintenance of the website. Any other transfer to third parties will not take place unless this is justified on the basis of applicable data protection regulations or if pv magazine is legally obliged to do so.
You may revoke this consent at any time with effect for the future, in which case your personal data will be deleted immediately. Otherwise, your data will be deleted if pv magazine has processed your request or the purpose of data storage is fulfilled.
Further information on data privacy can be found in our Data Protection Policy.